
Creating a dashboard
A dashboard is a collection of reports and lists that allow you to view all your most important metrics at a glance. Add user & account reports and lists to track those metrics both regularly and simultaneously.
Creation flow
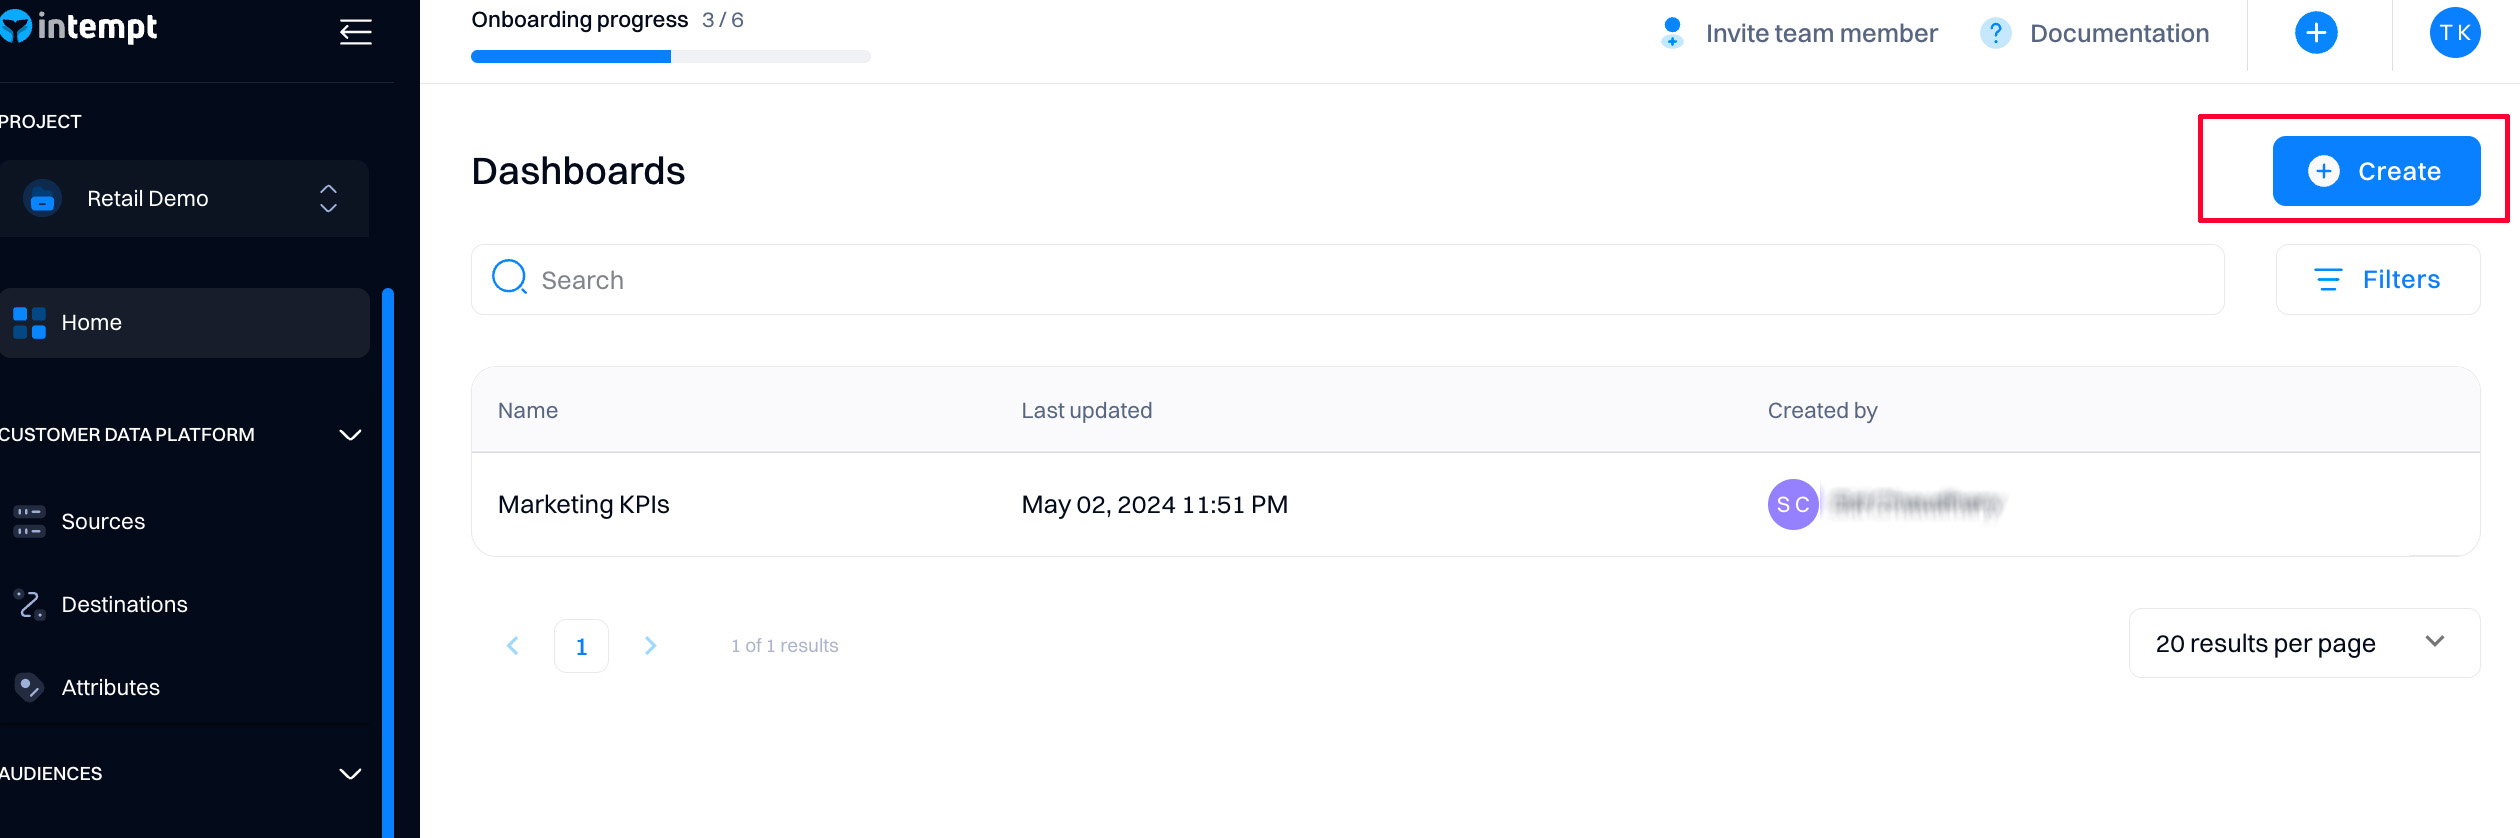
Go to Dashboards and select "Create dashboard"
As the next step, you can start configuring your dashboard. You can add Reports or Lists to your board.
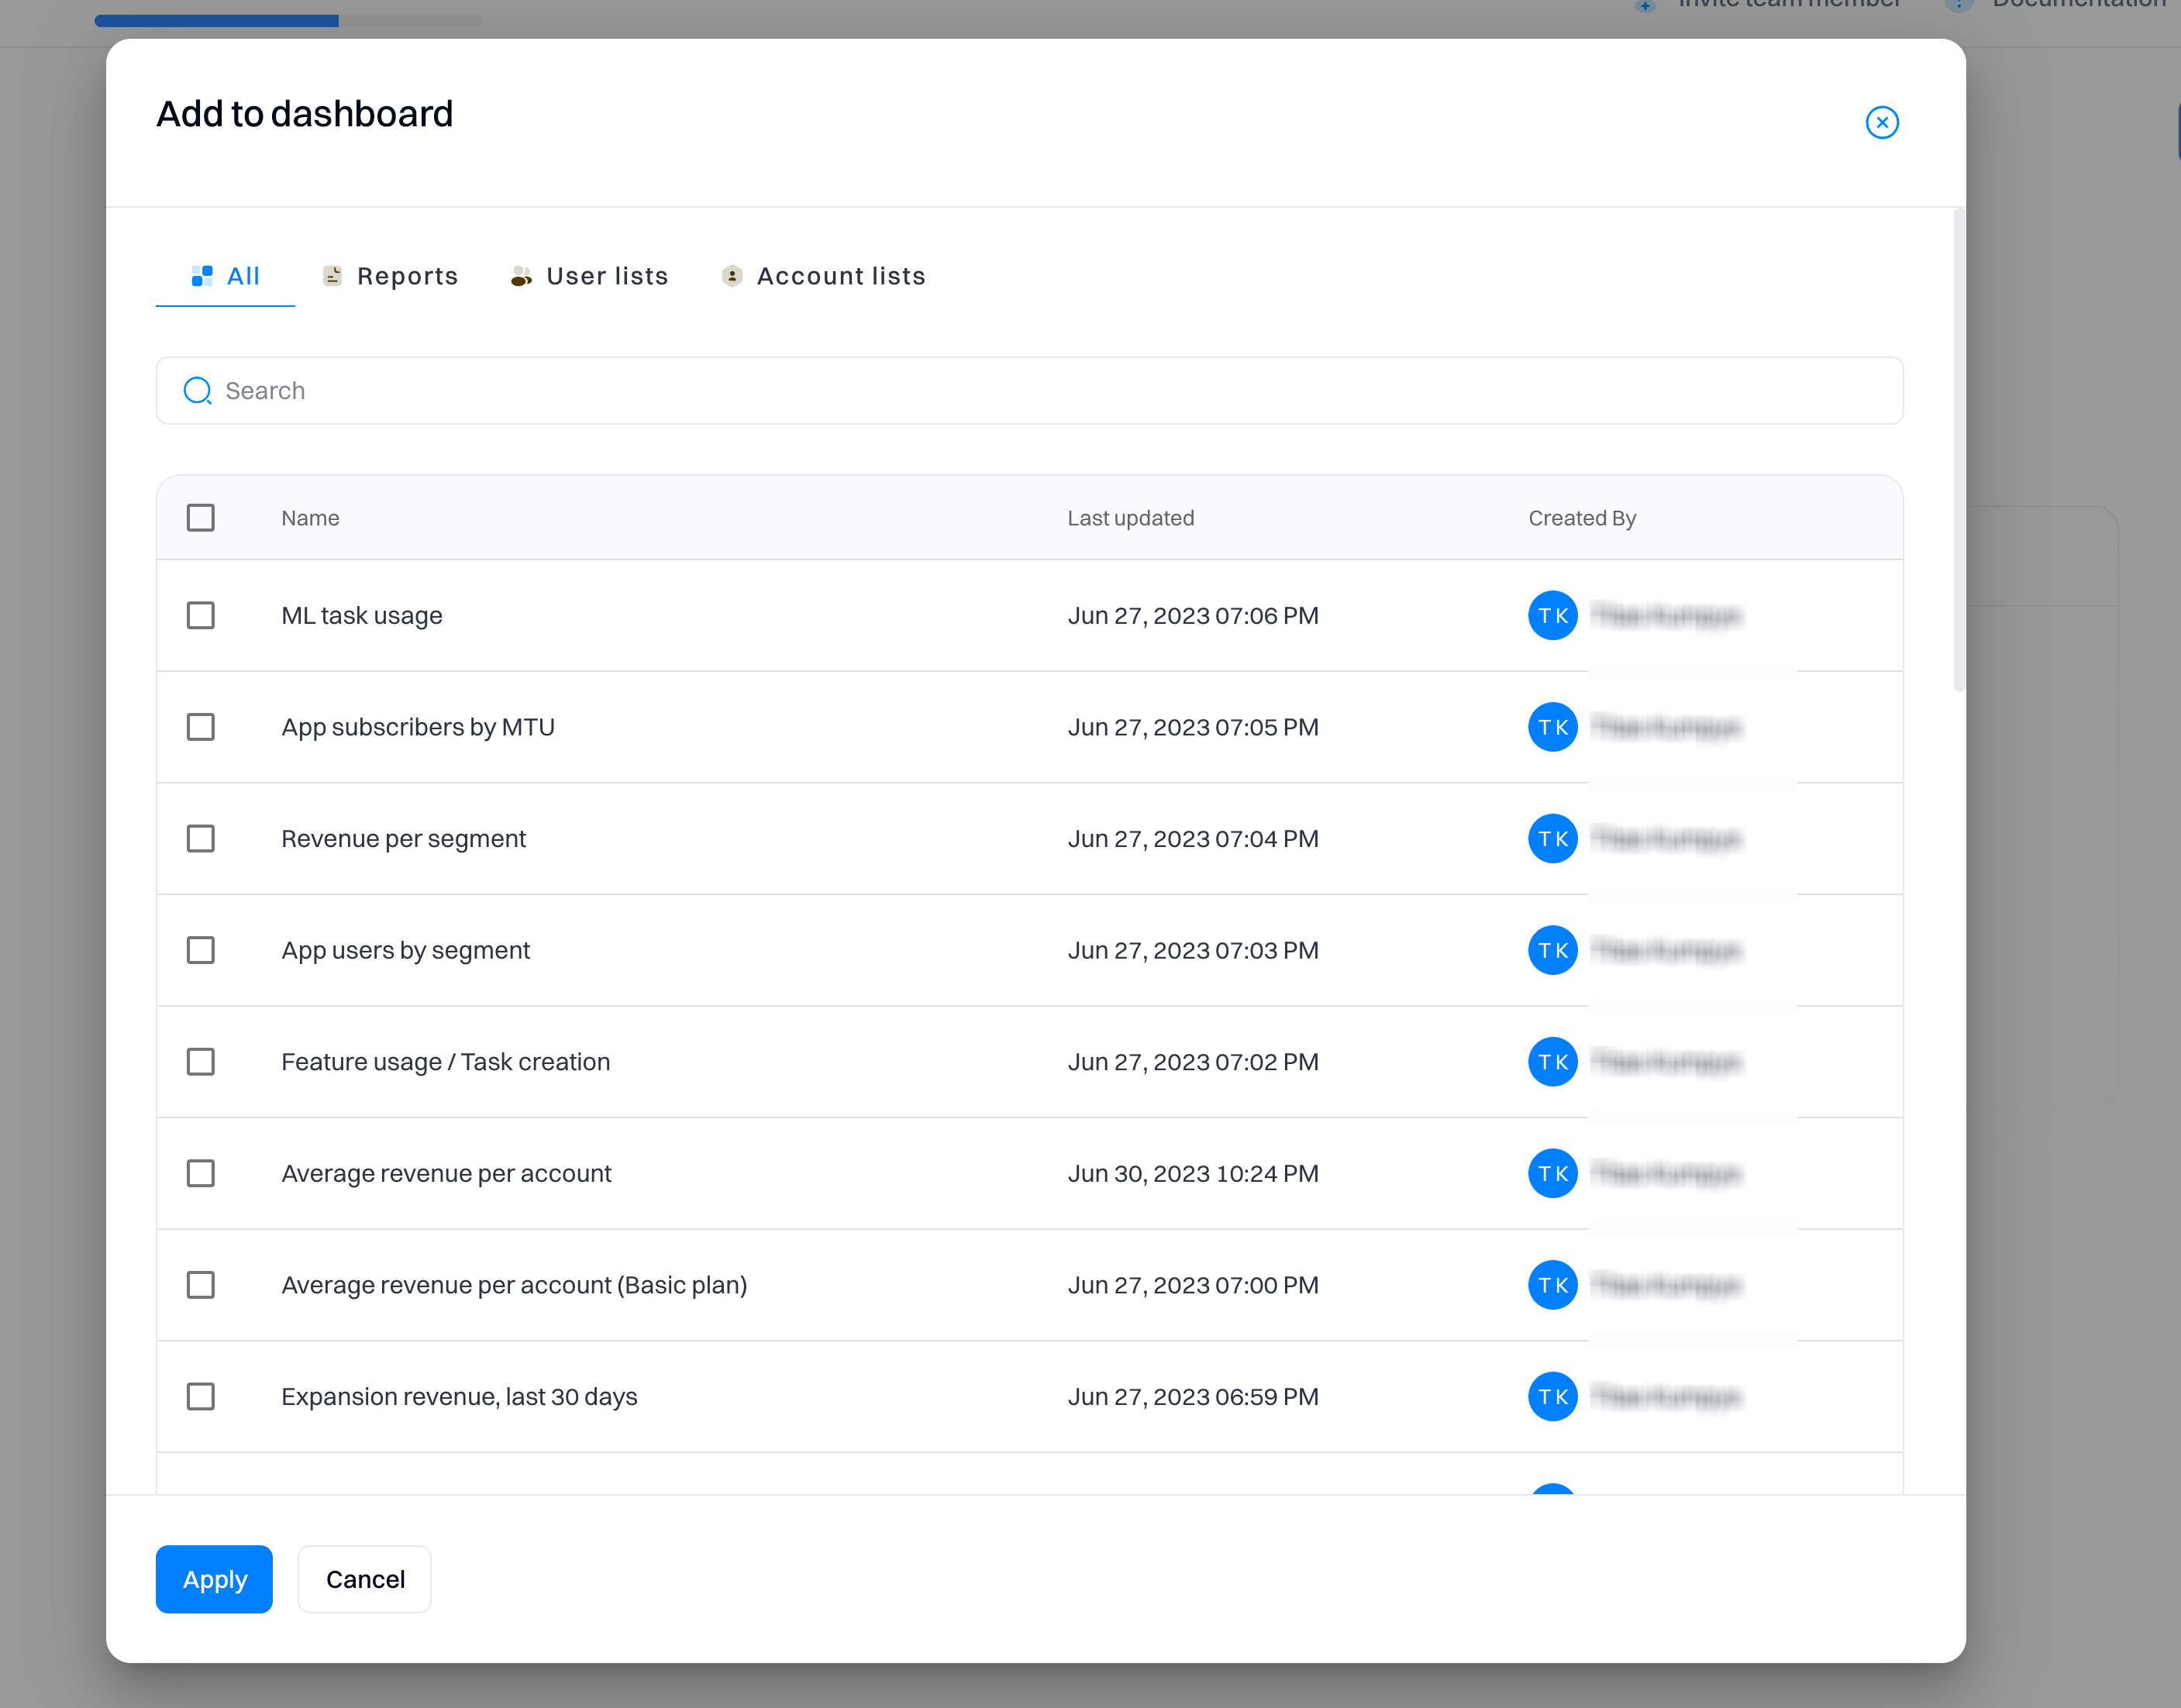
Reports
Any Reportsyou created in the project are available to add to the board. You can add multiple reports within a single dashboard.
Good to know
If you want to change the configuration of the report, you need to change it on the report page itself.
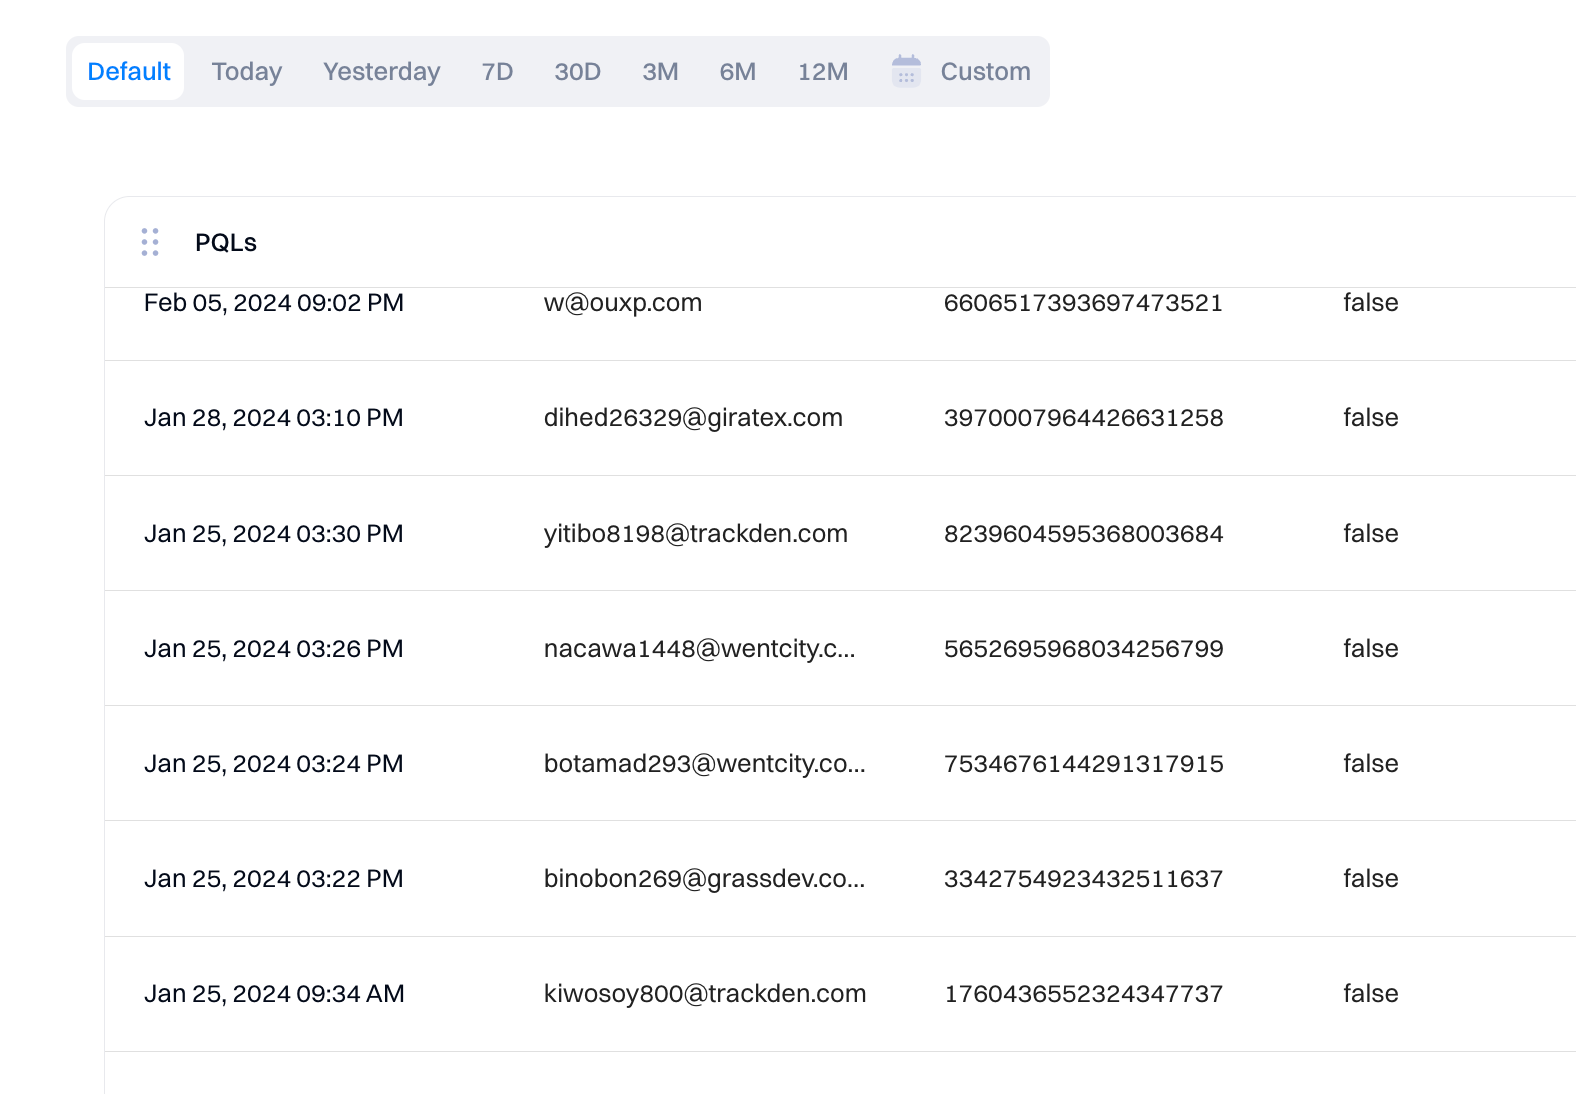
Lists
Lists are filtered user or account tables with a specific view (columns) displayed. Instead of going to the individual lists each time, you can display them in the dashboard in a single view.
Good to know
You can only change the list view (columns and filters) via the source configuration of the list itself.
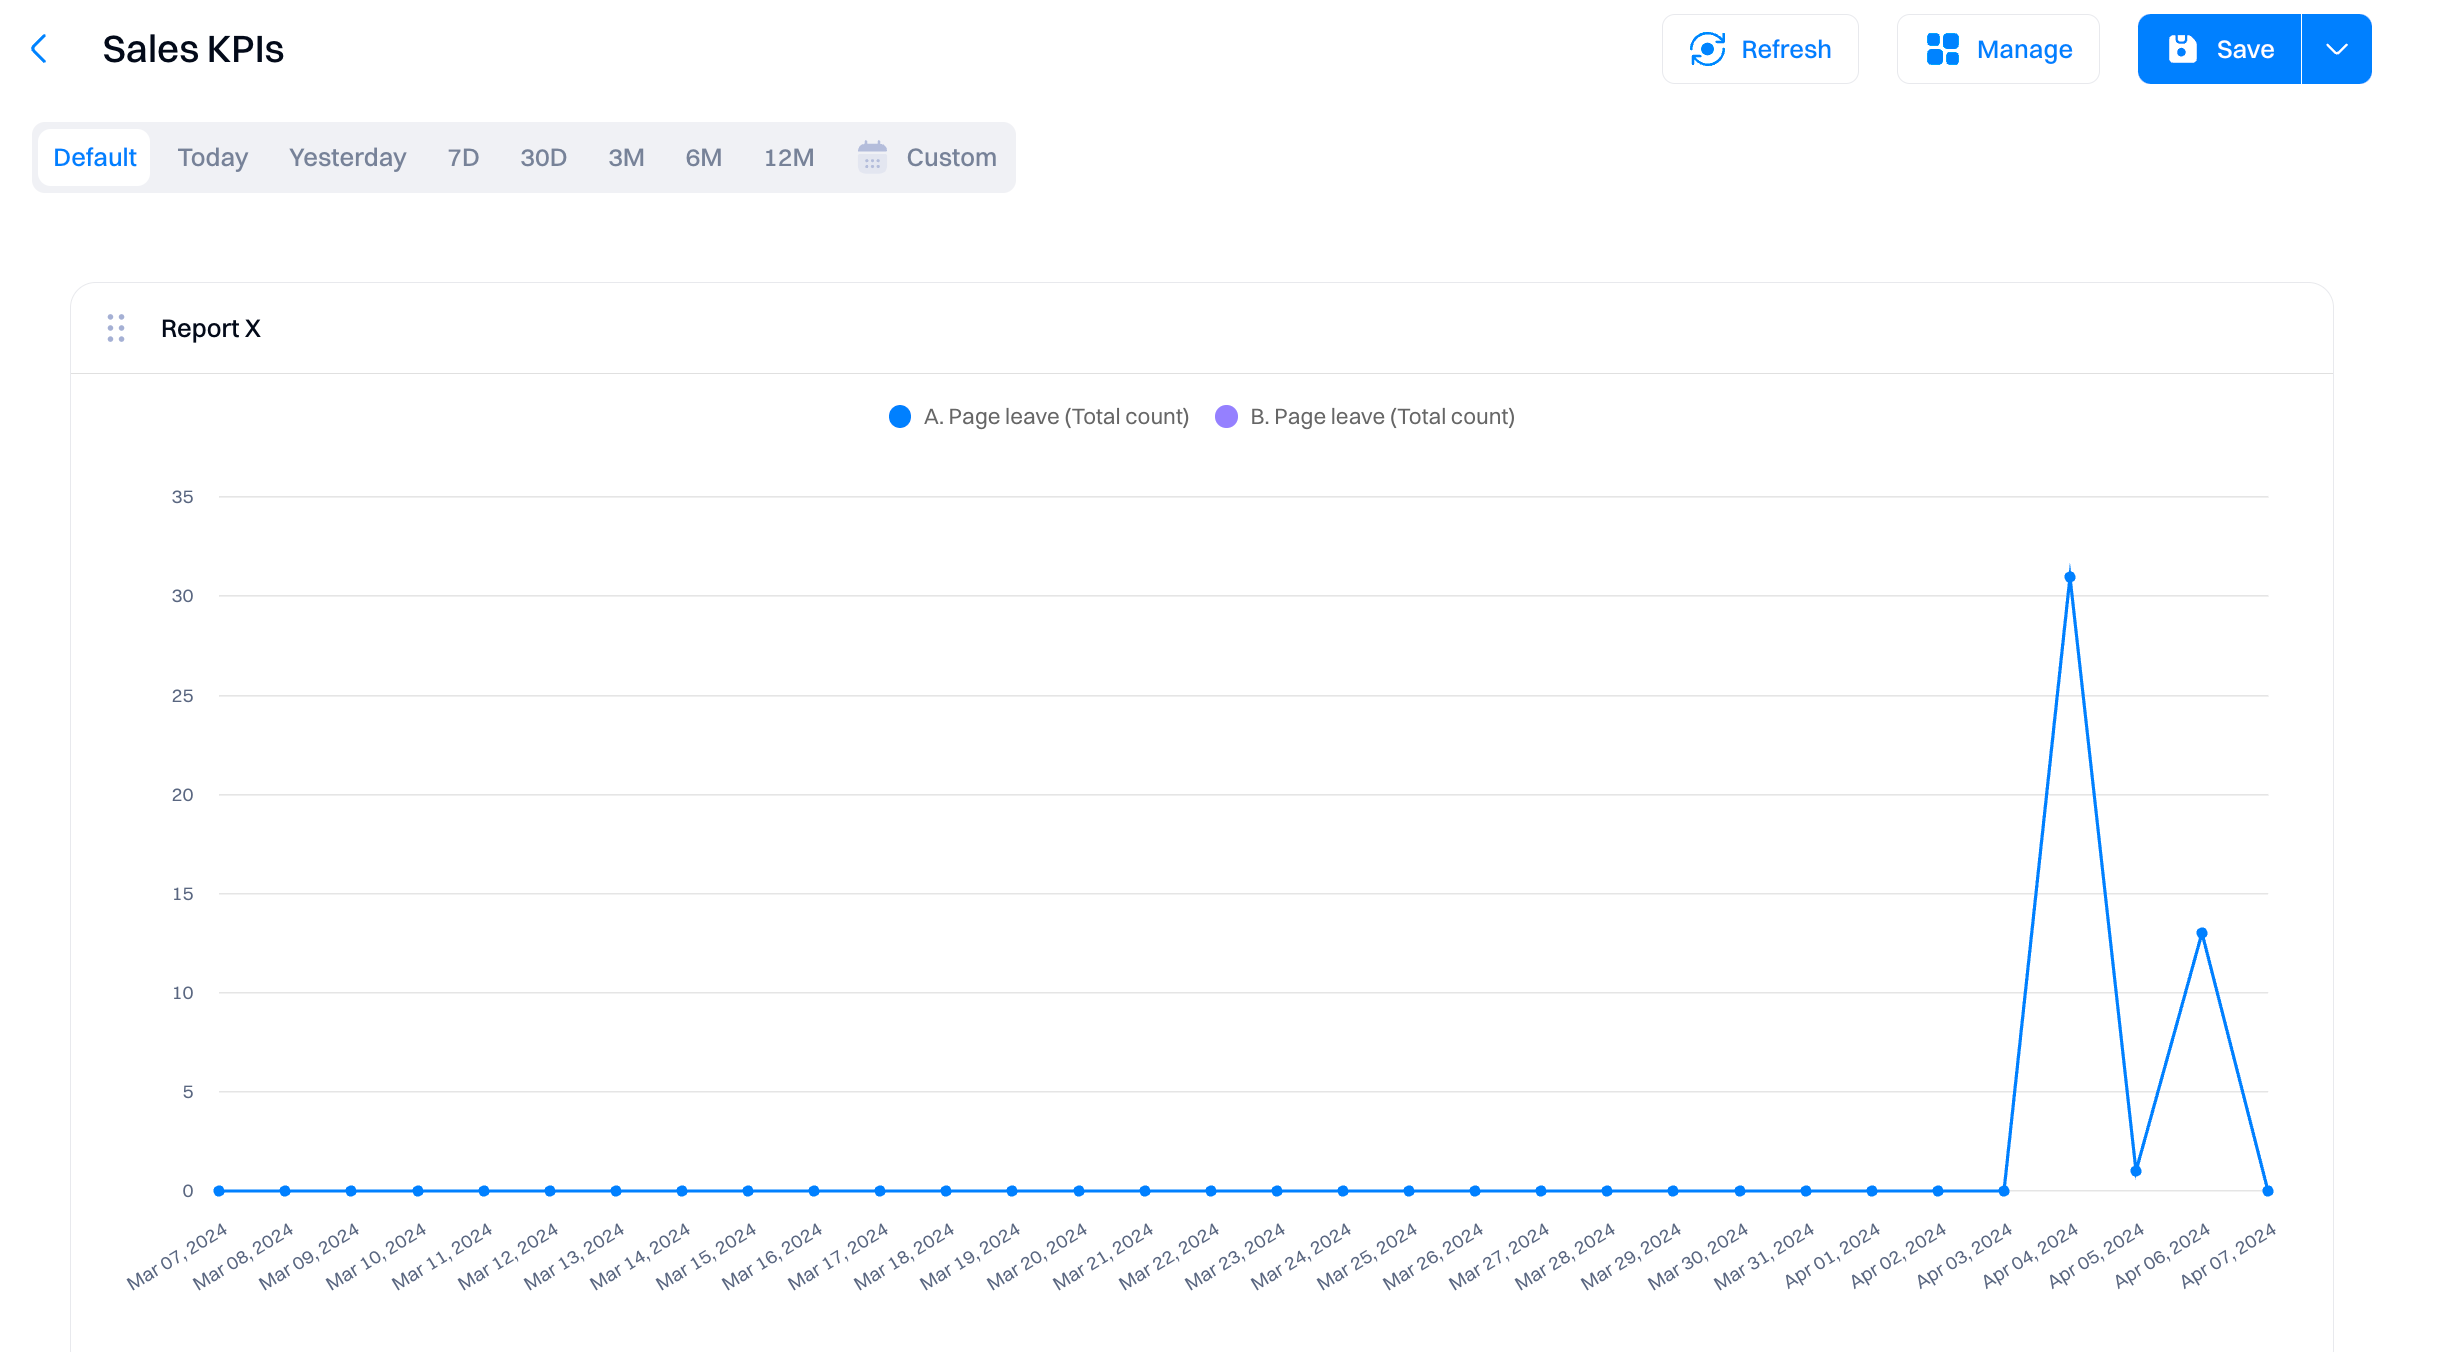
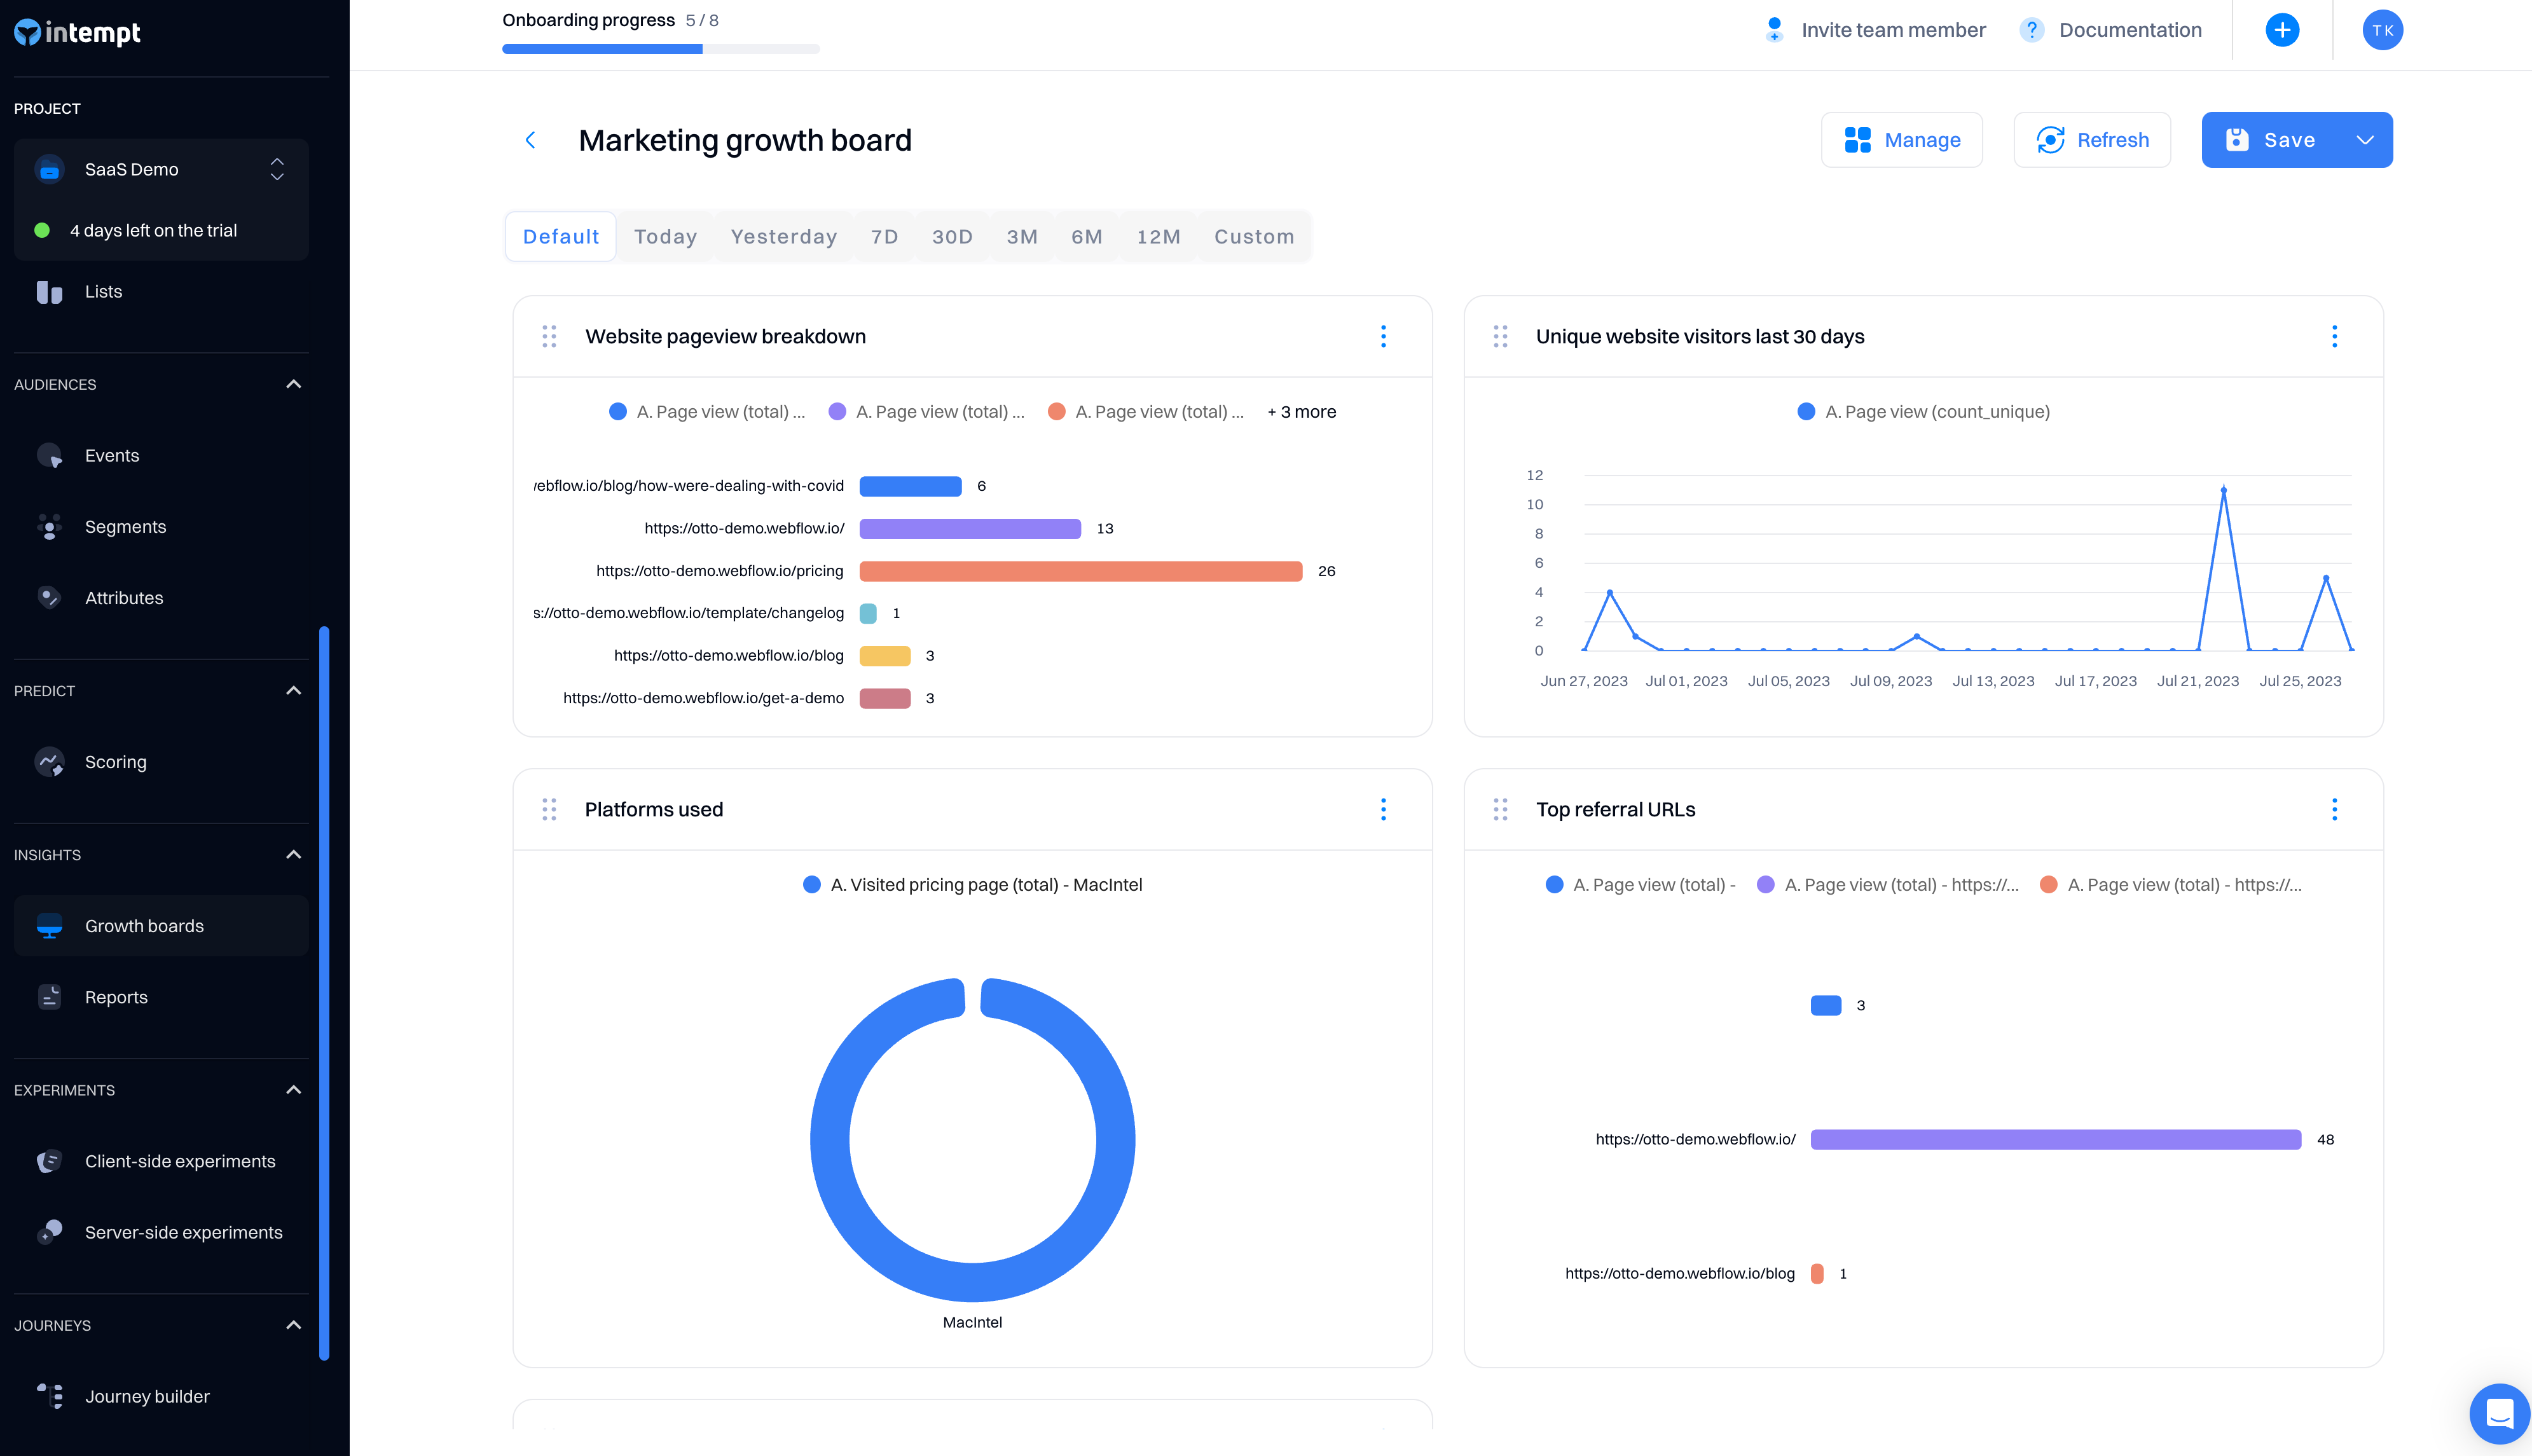
Viewing the dashboard
Once you select the reports, you can visualize them within the dashboard.
Go to Managing dashboards to learn how to update the resize the metrics in the dashboard.
Updated 9 months ago