
Event comparison
Overview
The Event comparison functionality allows you to compare the 2 already created events and access the differences in a chart.
Accessing the Event comparison
NOTE: to be able to compare the Events, there should be at least 2 Events created.
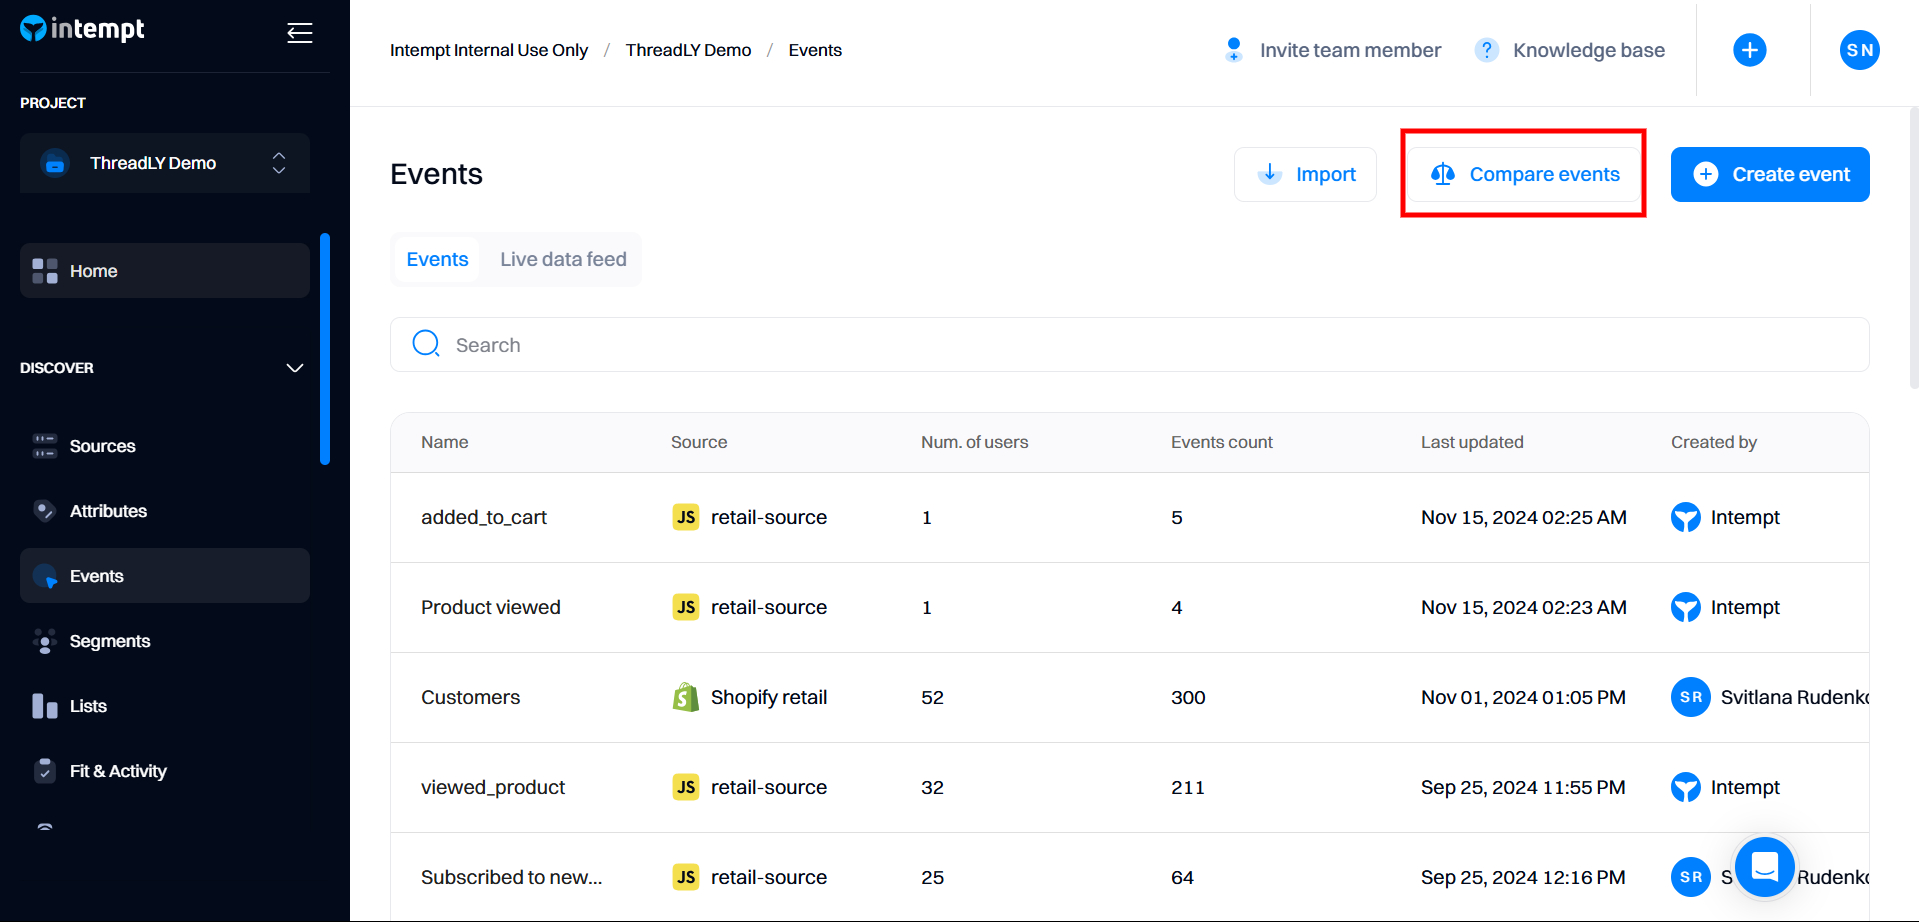
In the Events page, locate and click the "Compare events" button.
After clicking the button, users will be directed to the Compare events page, where you can specify the events to be compared from the respective dropdowns.

Once the events have been selected, you can access the event statistics visually.

Date range granularity
The graph granularity can be selected from:
- Day (D)
- Week (Wk)
- Month (Mo)
- Year (Yr)
- Custom
The selection can be made in the upper left corner of the graph.

Users/Events switch
To view different Event statistics, there is a Users/Events switch above the graph.
- Users - displays the number of users triggering the Event over a period of time
- Events - displays the number of times the Event has been triggered over a period of time

Line/Bar switch
Users can switch between the Line chart and Bar chart via a Line/Bar switch.

Statistics
To view numerical data at a certain point in time on the graph simply hover over the data point.

Updated about 2 months ago