
Sequential testing
Overview
Intempt's statistics engine runs on sequential testing method.
Sequential testing aims to achieve accelerated speed and greater scale of experimentation while also improving the accuracy of results and outcomes.
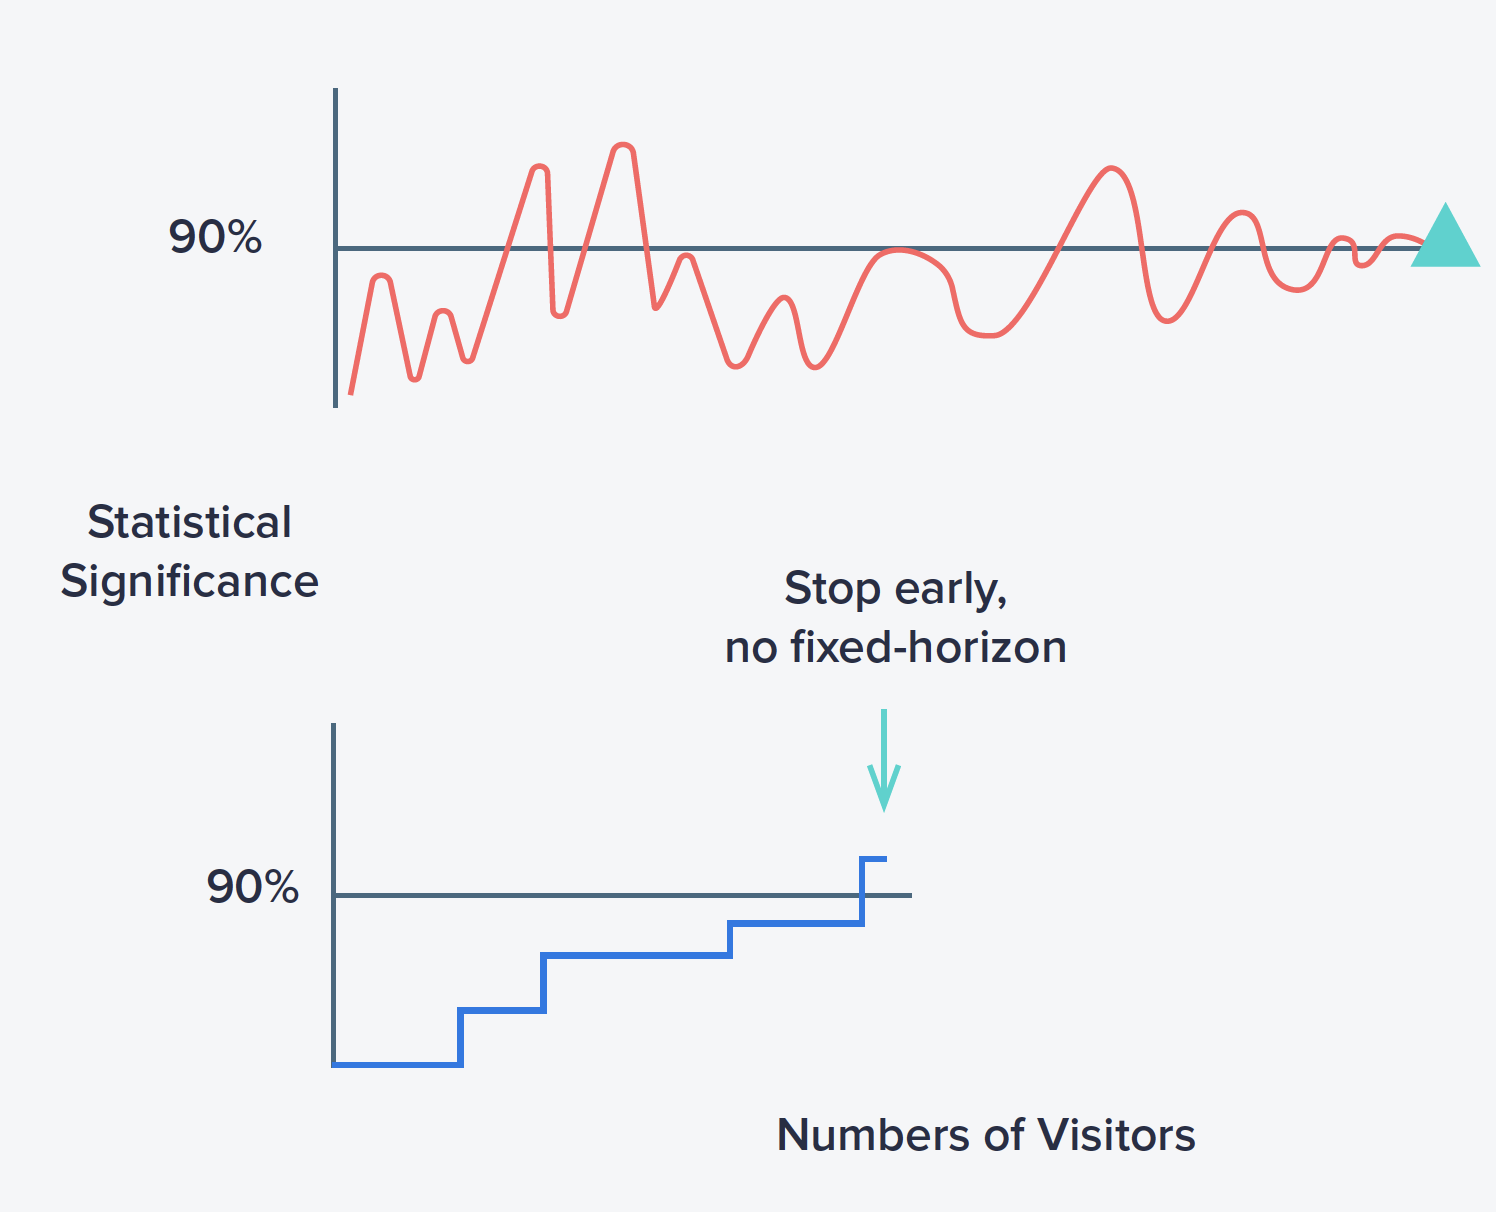
Traditional A/B testing best practices dictate that experiment metrics should be read out only once the target sample size of the experiment has been reached. Continuous monitoring for the purpose of decision-making results in inflated false positive rates (a.k.a. the peeking problem), much higher than expected based on the significance level selected for the test.
This is because p-values fluctuate and are likely to drop in and out of significance just by random chance, even when there is no real effect. Continuous monitoring introduces selection bias in the date we pick for the readout: Selectively choosing a date based on the observed results is essentially cherry-picking a stat-sig result that would never be observed if the data were to be analyzed only over the entire, pre-determined duration of the experiment. This increases the false positive rate (observing an experimental effect when there is none).
In Sequential Testing, the p-values for each preliminary analysis window are adjusted to compensate for the increased false positive rate associated with peeking. The goal is to enable early decision-making when there's sufficient evidence while limiting the risk of false positives. While peeking is typically discouraged, regularly monitoring experiments with sequential testing is particularly valuable.
The benefits of sequential testing
1. Continuous monitoring is fundamental to sequential testing. Sequential testing was specifically designed to let you monitor results in real-time so that you can make decisions more quickly without sacrificing the integrity of your data.
2. A sequential test achieves optimal statistical power. The statistical power of a sequential test naturally increases as the test runs, so detecting small effects no longer requires any arbitrary guesses about your effect sizes.
3. Continuous monitoring plus optimal power means faster results. Statistics Engine adapts to the true effect size automatically and allows you to stop early for larger-than-expected effect sizes, enabling faster times to significance on average.
4. Unexpected regressions: Sometimes experiments have bugs or unintended consequences that severely impact key metrics. Sequential testing helps identify these regressions early and distinguishes significant effects from random fluctuations.
Traditional statistics vs. sequential statistics
Tradition statistics
-
Requires waiting before results can be viewed and require guesswork that can slow experiments.
-
Forces you to choose between speed and accuracy
-
Data Science Requires data science resources


Sequential Testing
-
It lets you monitor results in real time and stop early.
-
It gives you both speed and accuracy, there is no need to compromise
-
Built-in protections that eliminate risk and let everyone experiment
What gives Intempt's sequential method and edge ?
Intempt's Statistics Engine deploys a novel algorithm called the mixture sequential probability ratio test (mSPRT).
It compares after every visitor how much more indicative the data is of any improvement / non-zero improvement, compared to zero / no improvement at all. This is the relative plausibility of the variation(s) compared to the baseline.
The mSPRT is a special type of statistical test that improves upon the sequential probability ratio test (SPRT), first proposed by theoretical statistician David Siegmund at Stanford in 1985. That OG sequential probability ratio test from Siegmund was designed to test exact, specific values of the lift from a single variation in comparison to a single control by comparing the likelihood that there is a non-zero improvement in performance from the variation versus zero improvement in performance from the baseline.
Specifically, Intempt's mSPRT algorithm averages the ordinary SPRT across all possible improvements (for example, alternative lift values).
Intempt's statistics engine also employs a flavor of the Empirical Bayesian technique. It blends the best of frequentist and Bayesian methods while maintaining the always valid guarantee for continuous monitoring of experiment results.
Statistics Engine takes more evidence to produce a significant result, which allows experimenters to peek as many times as they desire over the life of an experiment. Statistics Engine also controls your false-positive rates at all times regardless of when or how often you peek, and further adjusts for situations where your experiment has multiple comparisons (i.e., multiple metrics and variations).
Controlling the False Discovery Rate offers a way to increase power while maintaining a principled bound on error.
False discovery control (Benjamini-Hochberg (BH) procedure)
The Benjamini-Hochberg method helps control the number of false positives when you are running a lot of tests at once.
Using traditional statistics in multiple comparisons results in a large increase in false positives. That means the chance of at least one variation being incorrectly declared a winner is much higher than expected.
False discovery rate control lets you test multiple variations and metrics without inflating errors.
You need to employ the Benjamini-Hochberg (BH) procedure to control FDR.
This method automatically corrects significance values so that the FDR is properly controlled. It uses the deflated values to determine when to call winners and losers.
For example, in an experiment with a significance level set at 90%, Statistics Engine FDR correction will produce corrected significance values that, when compared to the 90% threshold to declare winners, will always guarantee FDR of no greater than 90% in that experiment.

The BH procedure applies a different level of deflation to each metric-variation according to its rank by significance. The central idea is that the relative ranked significance values gives you information about the relative prevalence of true positives, and therefore enables good control of the FDR as opposed to the false positive rate.
Displaying these automatically-corrected values frees the user from the BH procedure’s complicated definition. It also allows direct interpretation of the significance value in the context of a correction. As a result, no extra steps are needed to rigorously control for multiple comparisons. For this reason, we should calculatee significance as (1 - FDR) so that significance now represents the chance that a significant test is a true winner or loser, rather than the chance that the significant result is actually a fluke arising from an A/A test.
Updated 9 months ago