
Confidence intervals
Confidence interval
Confidence interval refers to an estimated range of values that are likely, but not guaranteed, to include the unknown but exact value summarizing your audience if you replicated an experiment numerous times. Confidence intervals consider the size of the sample exposed to an experiment and the amount of variability, that is, dispersion or noise, in that experiment sample.
Confidence intervals contain:
- A point estimate (lift) – A single value derived from your statistical model of choice.
- A margin of error – Around the point estimate that indicates the amount of uncertainty surrounding the sample estimate from the population.
You should report confidence intervals to supplement your statistical significance results, as they can offer information about the observed effect size of your experiment.
Intempt's confidence interval is adaptive. The experiment results page shows the running intersection of all previous confidence intervals by tracking the smallest upper limit and the largest lower confidence interval limit values during the experiment runtime. The largest lower limit means the less negative value or the value closest to zero. This technique ensures the optimal tradeoff of estimating the bias and the variance so you can feel confident about the result.
When Intempt declares significance
A variation is declared significant when the confidence interval stops crossing zero. Intervals that cross zero mean there is not enough evidence to say whether there is a clear impact.
When a variation reaches statistical significance, the confidence interval constantly lies above or below 0.
- Winning variation – The confidence interval is entirely above 0%.
- Inconclusive variation – The confidence interval includes 0%.
- Losing variation – The confidence interval is entirely below 0%.
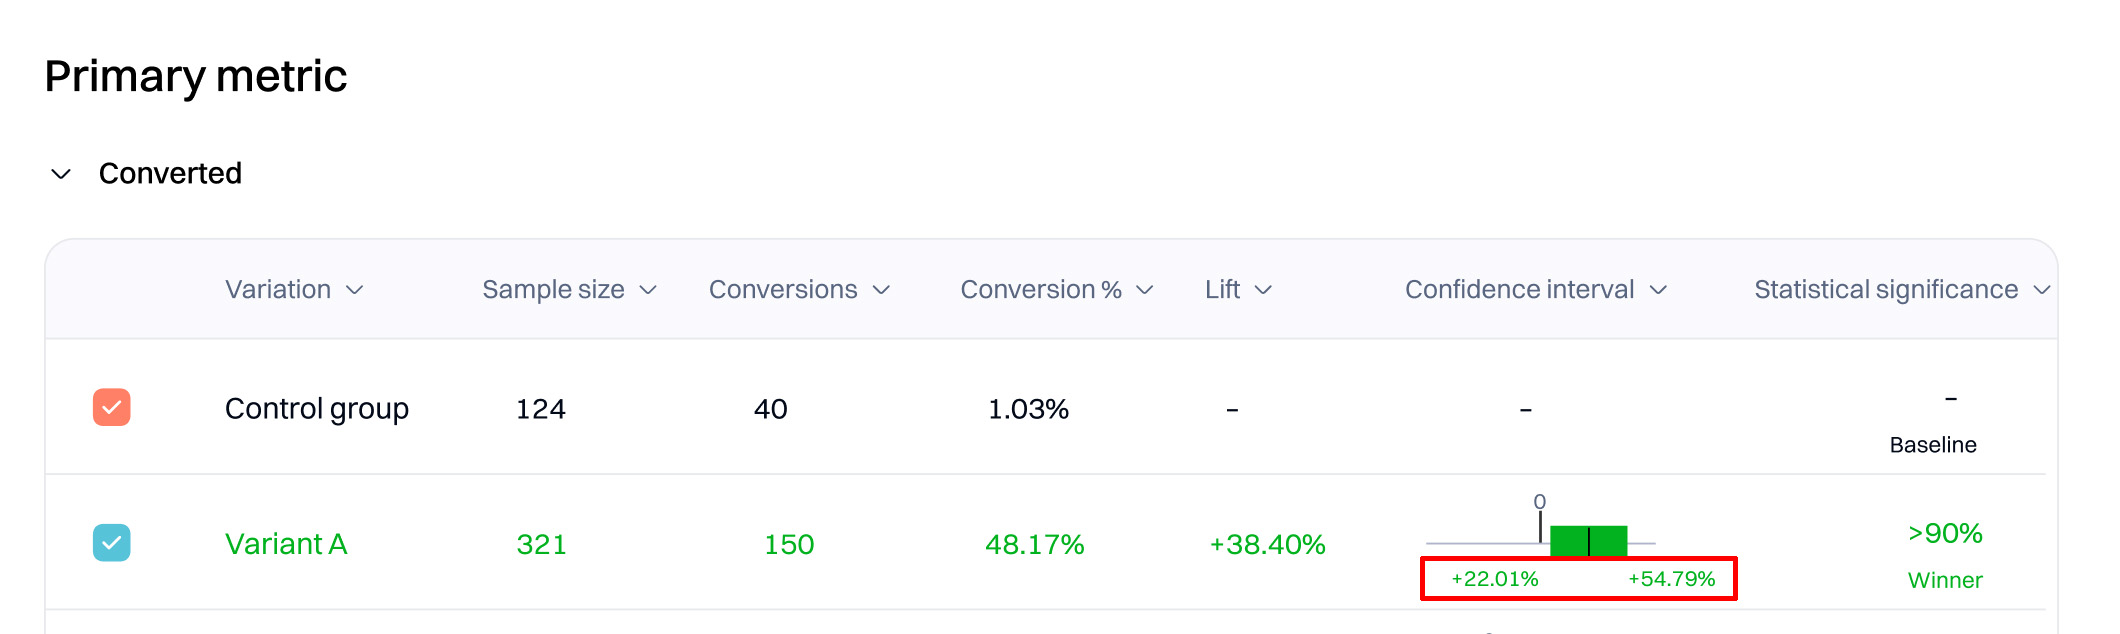
Confidence interval entirely above zero percent
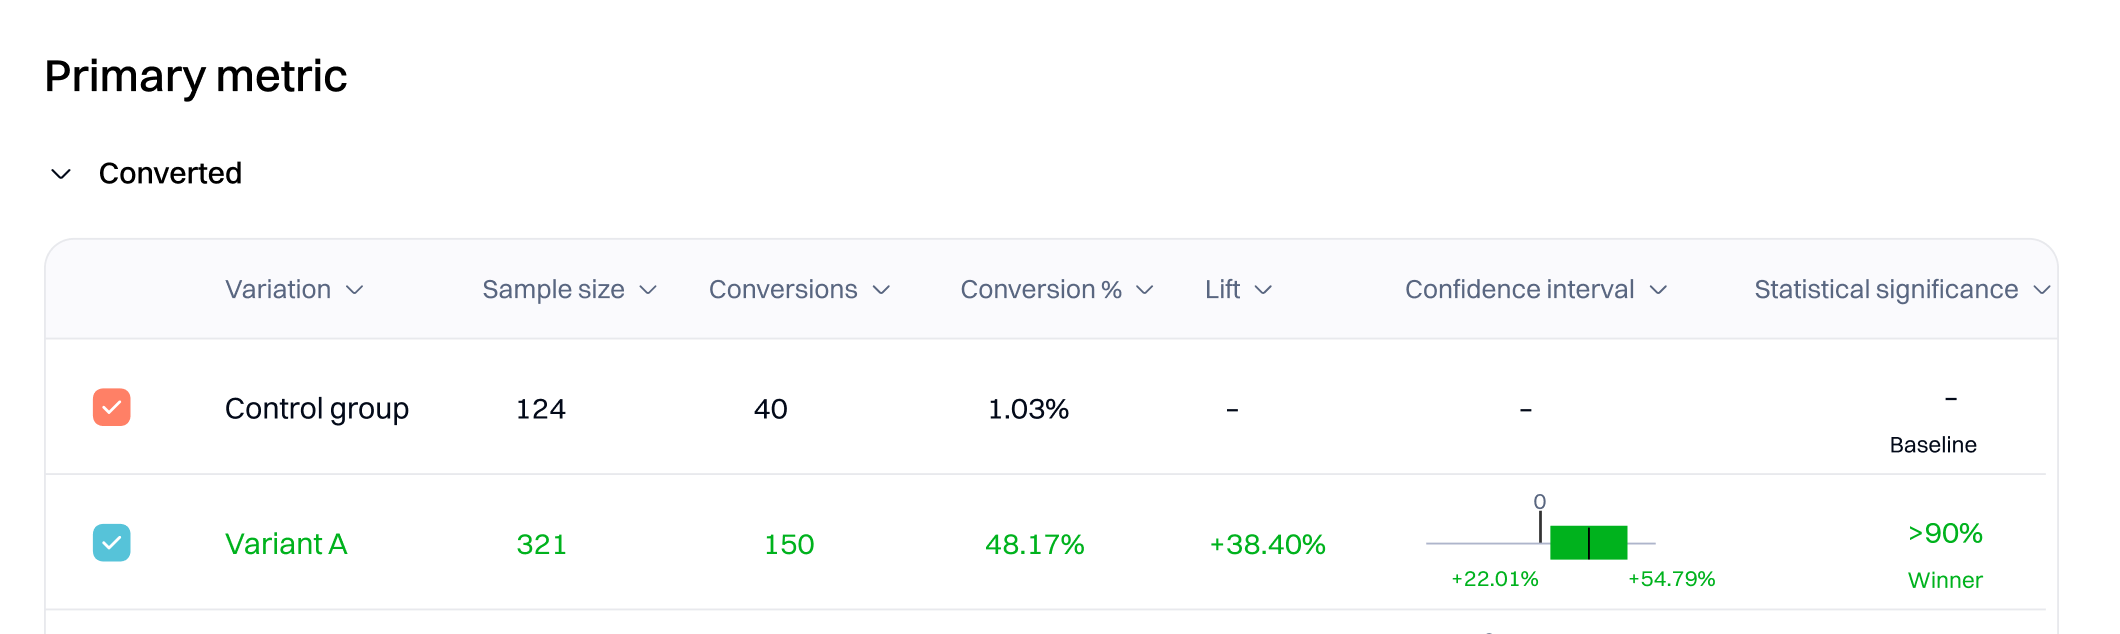
In the preceding screenshot, enough evidence has accumulated so far that it is highly unlikely that the lift observed here is due to random chance alone. But, the lift Intempt measured (+38.40%) may be different from the exact lift you see going forward. The confidence interval indicates that this test variation will have a positive impact in the long run. For this experiment iteration, the error bounds were between 22.01% and 54.79% lift.
The statistical significance setting for this example is 90%. As Intempt collects more data, the confidence interval may narrow.
Confidence interval includes zero percent
If you stop the A/B test early or have a low sample size, the confidence interval will give you an idea of whether implementing that variation will have a positive or negative impact.
When you see low statistical significance on specific variations, the confidence interval can be another data point to help you make decisions. When you have an inconclusive variation, the interval will look like this:
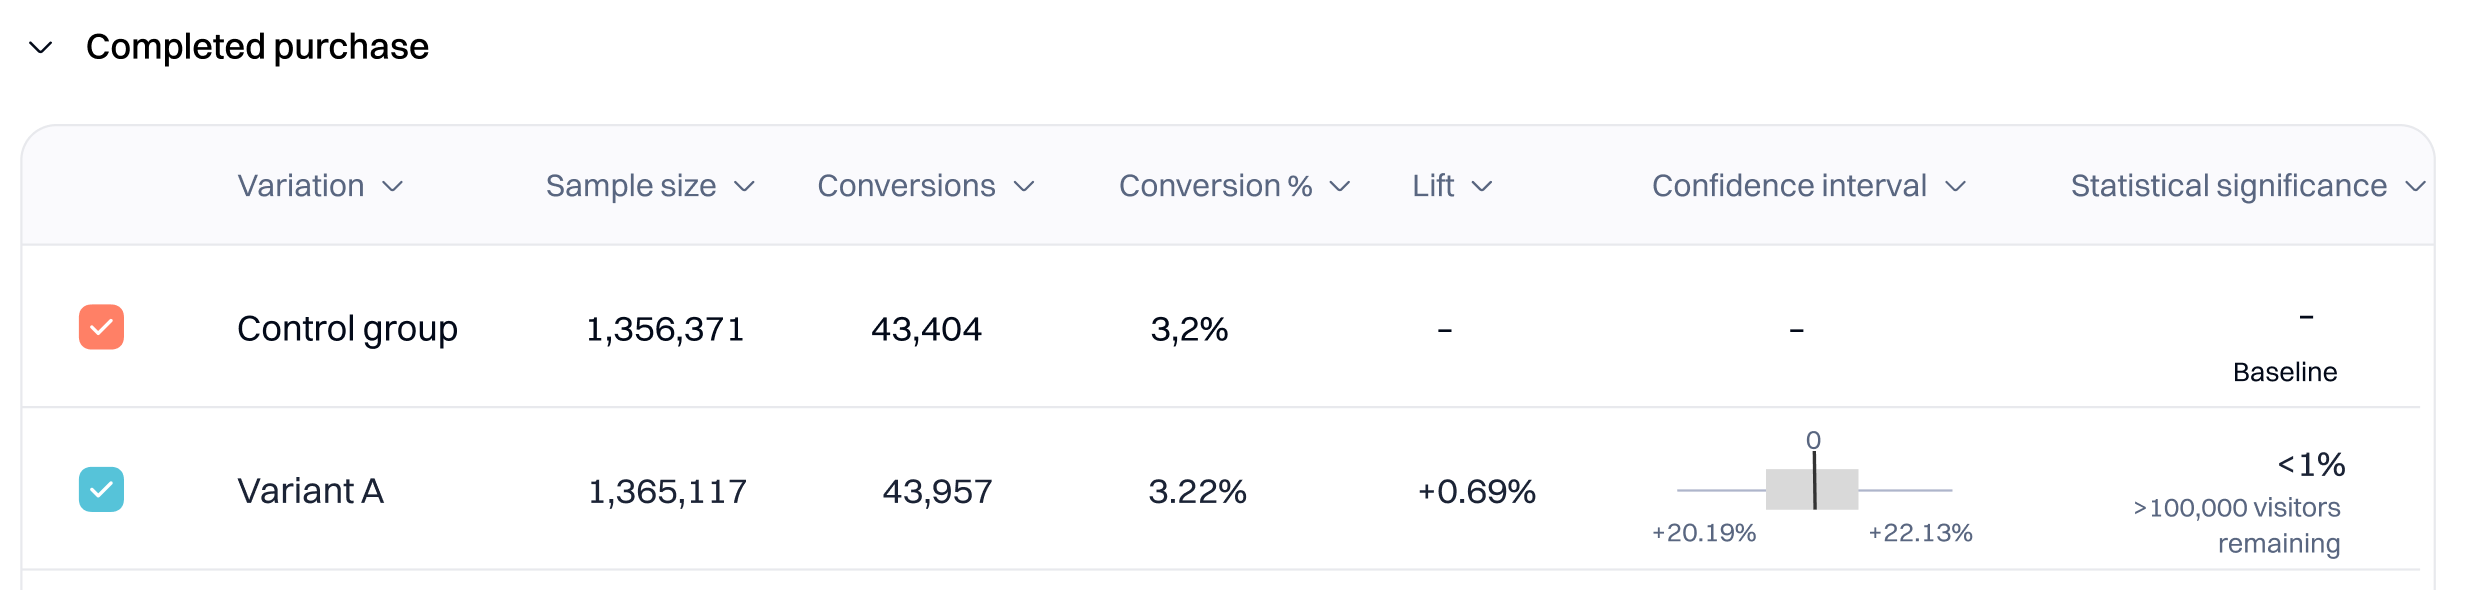
This variation's conversion rate is between -20.19% and 22.13%. You can interpret the confidence interval as a worst-case, middle-ground, and best-case scenario. Intempt is 90% confident that the difference between the variation and baseline conversion rates is:
- Worst-case – -20.19%
- Middle-ground – 0.69%.
- Best-case – 22.13%
Confidence interval entirely below zero percent
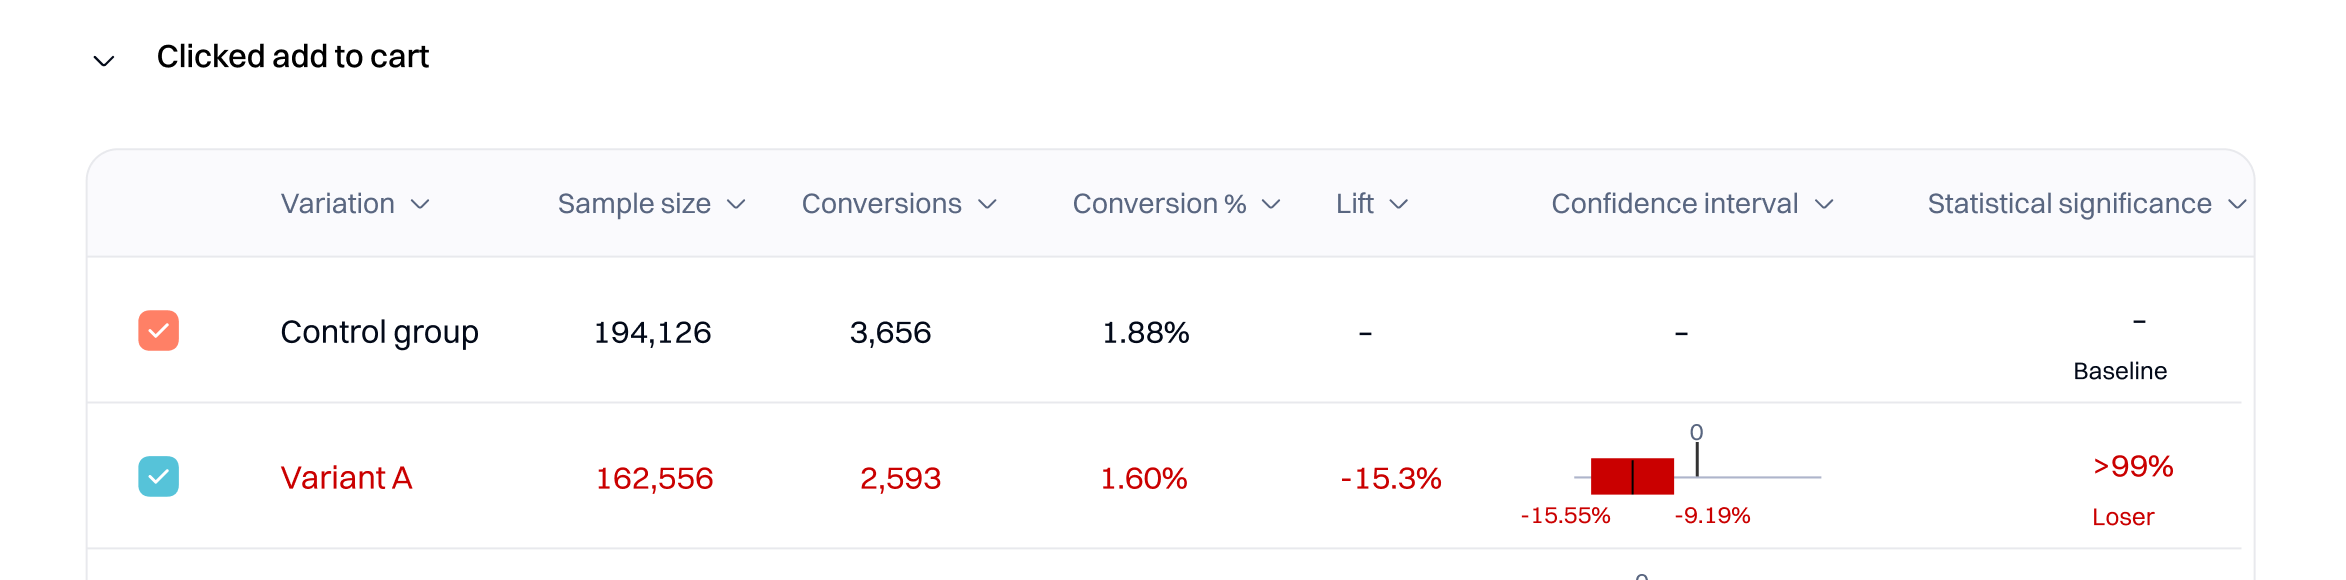
In this example, enough evidence has accumulated so far that it is highly unlikely that the negative lift observed here is due to random chance alone. The negative lift measured (-15.3%) will likely be what you see going forward. The confidence interval indicates that this test variation will negatively impact the long run. For this experiment iteration, the error bounds were between -15.55% and -9.19% lift. If this experiment was rerun, the baseline and variation conversion rate difference would probably be in the same range.
How statistical significance and confidence intervals are connected
The experiment shows the statistical likelihood that the lift is due to changes you made on the page, not chance. Until Statistics Engine has enough data to declare statistical significance, the experiment results page will state that more visitors are needed and show you an estimated wait time based on the current conversion rate.

Lower significance levels may increase the likelihood of error but can also help you test more hypotheses and iterate faster. Higher significance levels decrease the error probability but require a larger sample.
Choosing the right significance level should balance the types of tests you are running, the confidence you want to have in the tests, and the amount of traffic you receive.
Good to know
Significance and confidence intervals are connected but are not the same. Your experiment reaches significance precisely when your confidence interval on lift moves away from zero.
Lift intervals
Experimentation will display the relative lift in conversion rate for the variation over the baseline as a percentage. This is true for all A/B test metrics, regardless of whether they are binary or numeric conversions.
In Intempt experiments, a relative lift interval of 1% to 10% means that the variation sees between 1% and 10% lift over the baseline. For example, if the baseline conversion rate is 25%, the variation conversion rate will fall between 25.25% and 27.5%.
Updated 9 months ago