
Managing dashboards
Updating dashboards
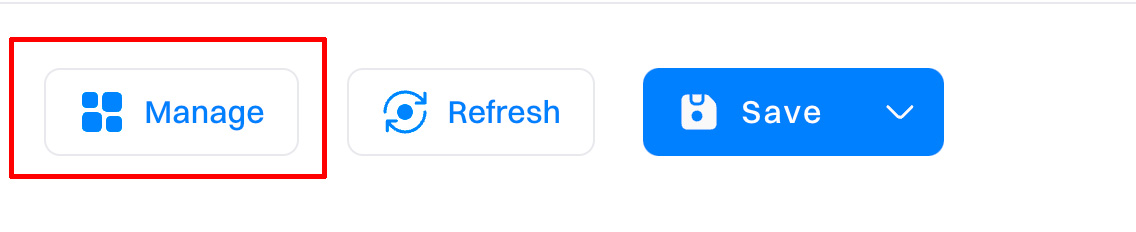
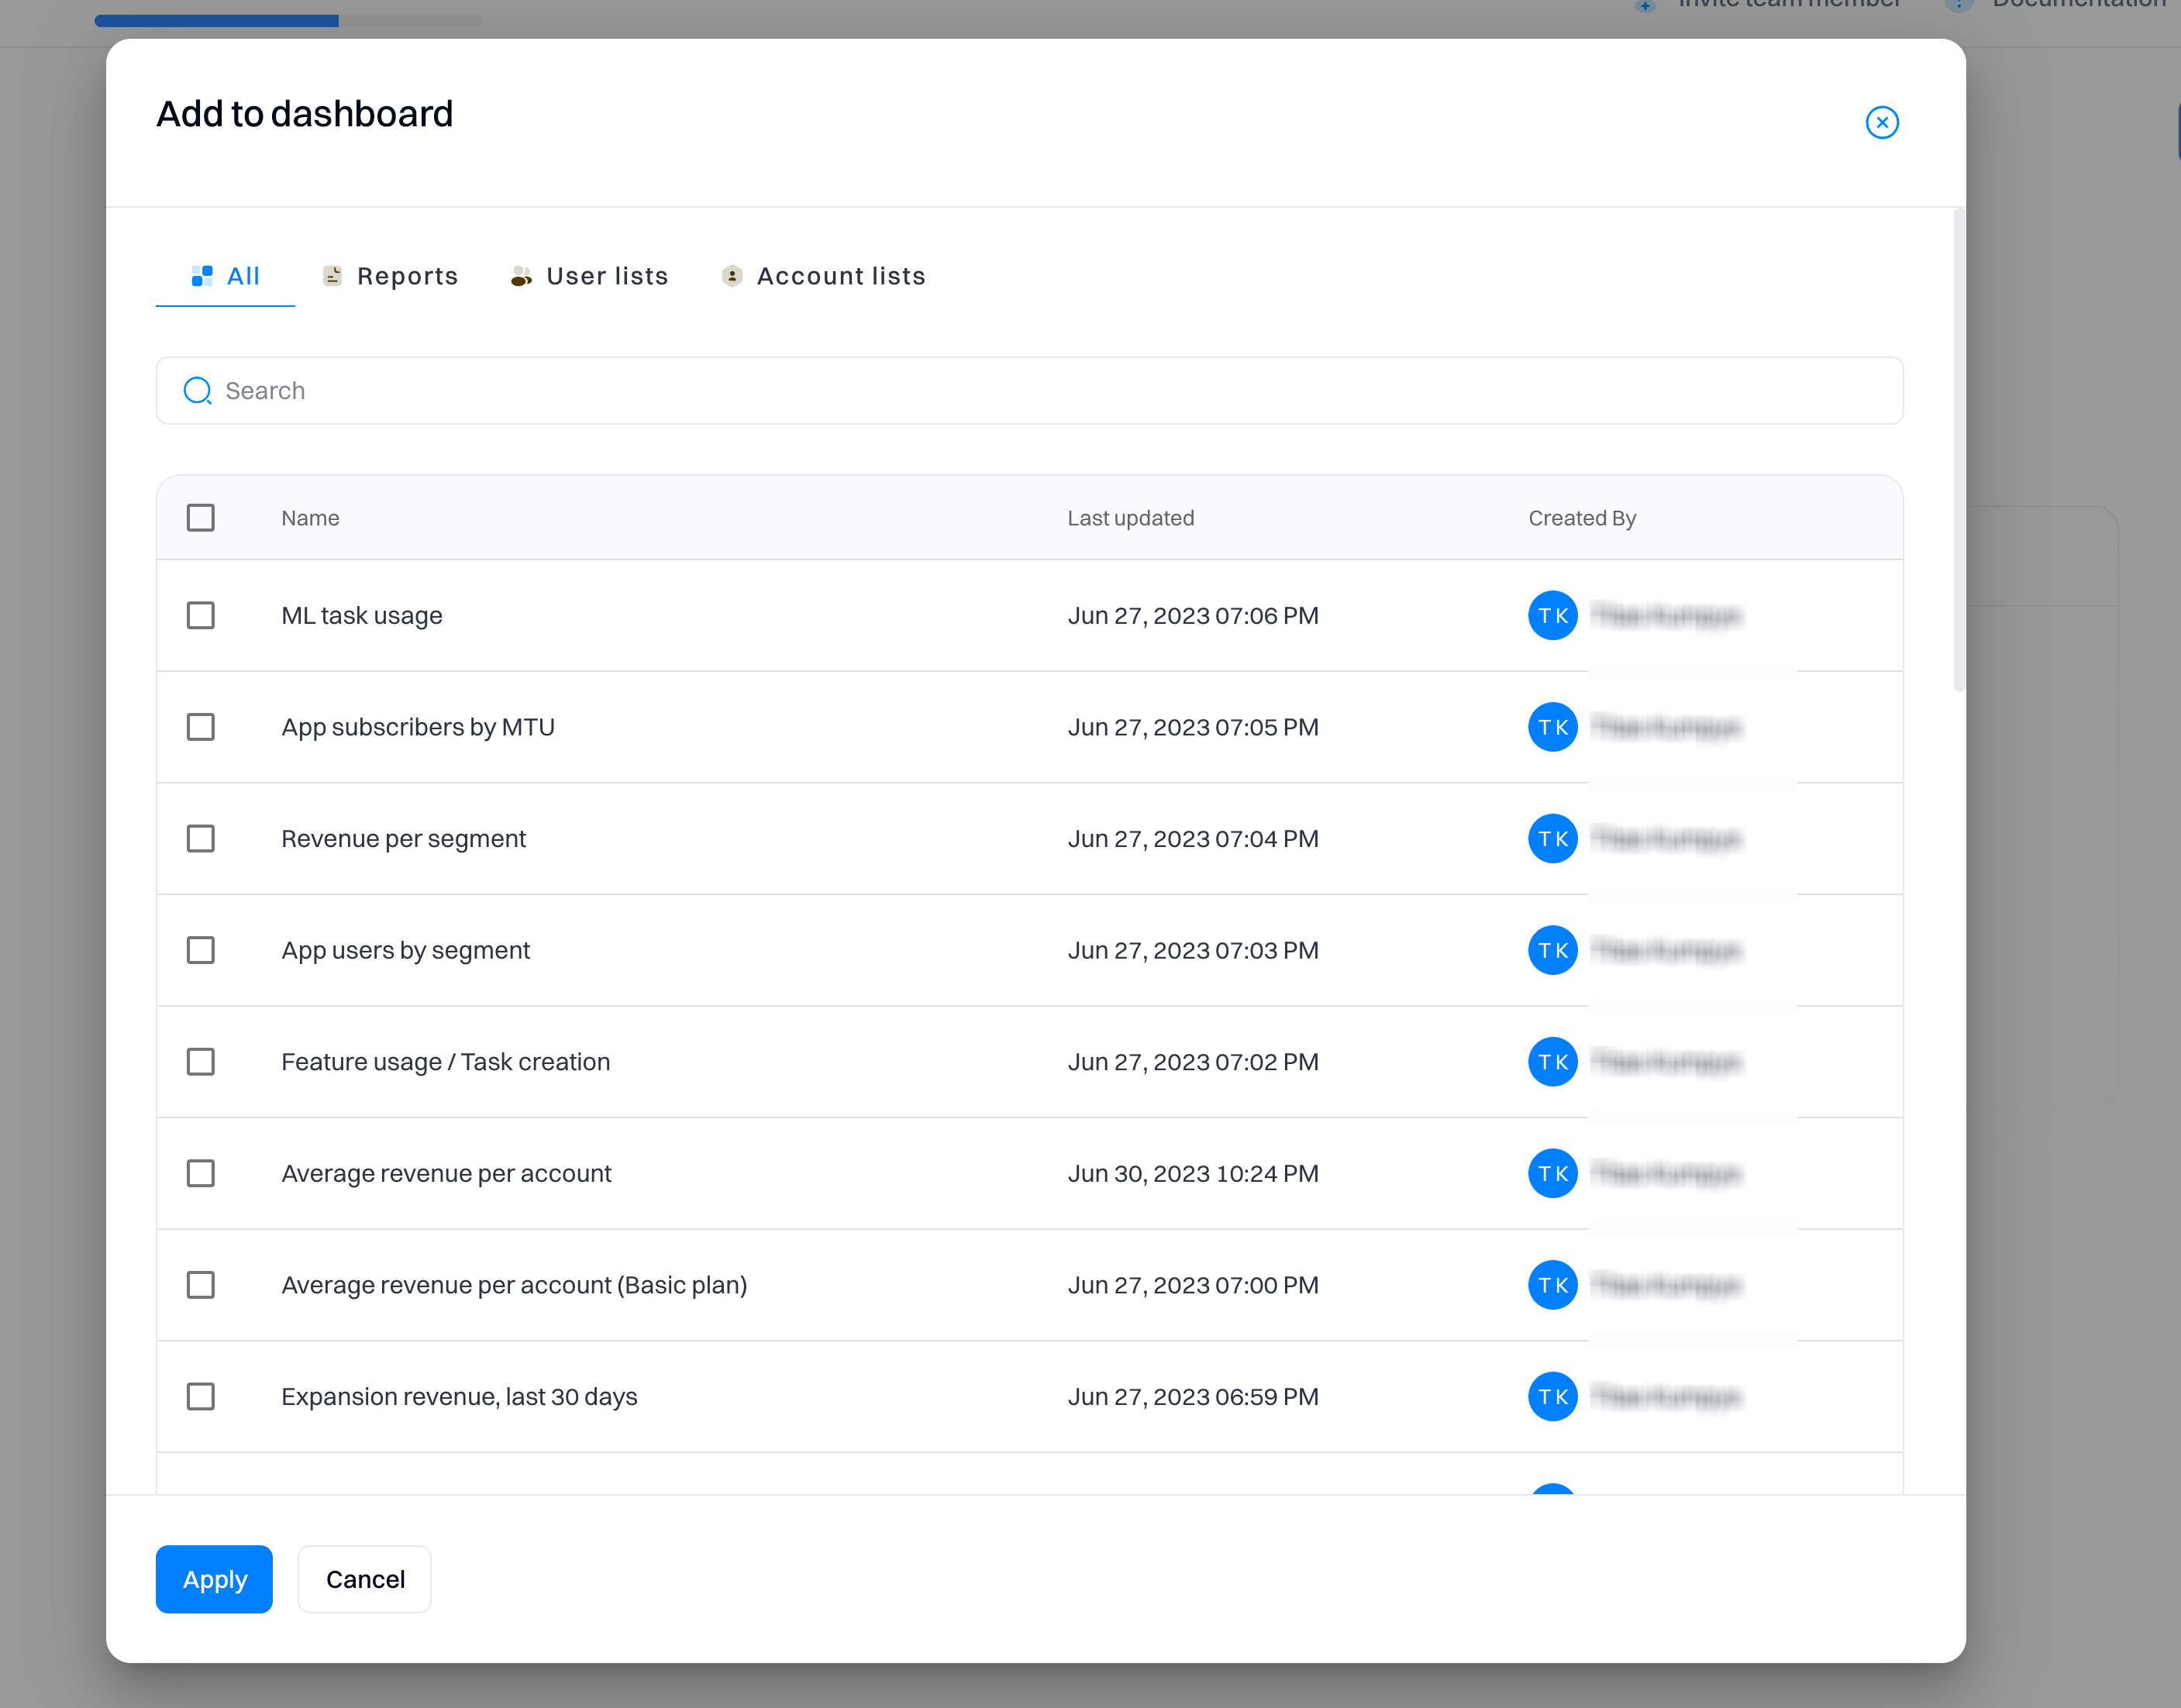
If you want to update a created dashboard, you can do so by clicking the "Manage" button. A new window will appear where you can see the currently selected objects in the dashboard and select new ones.
Date range
The created dashboard can be adjusted to match the date range. You can select a required period from the calendar by selecting the desired date range granularity (Day, Week, Month, Year). The calendar will show the dates based on the selected range granularity.

| Tab value | Meaning | Description |
|---|---|---|
| Default | Default | The dashboard will use the values that were saved within the report. |
| Custom | Custom | You can select a specific date range, e.g., May 1 - May 31 |
| Today | Today | Includes the current incomplete day up to the current second. |
| Yesterday | Yesterday | Includes the whole of the previous day from midnight to midnight. |
| 7D | Last 7 days | Last 7 days and the query count from the current incomplete day up to the current second. |
| 30D | Last 30 days | Last 30 days and the query count from the current incomplete day up to the current second. |
| 3M | Last 3 months | Last 3 months and the query count from the current incomplete day up to the current second. |
| 6M | Last 6 months | Last 6 months and the query count from the current incomplete day up to the current second. |
| 12M | Last 12 months | Last 12 months and the query count from the current incomplete day up to the current second. |
Editing the dashboard
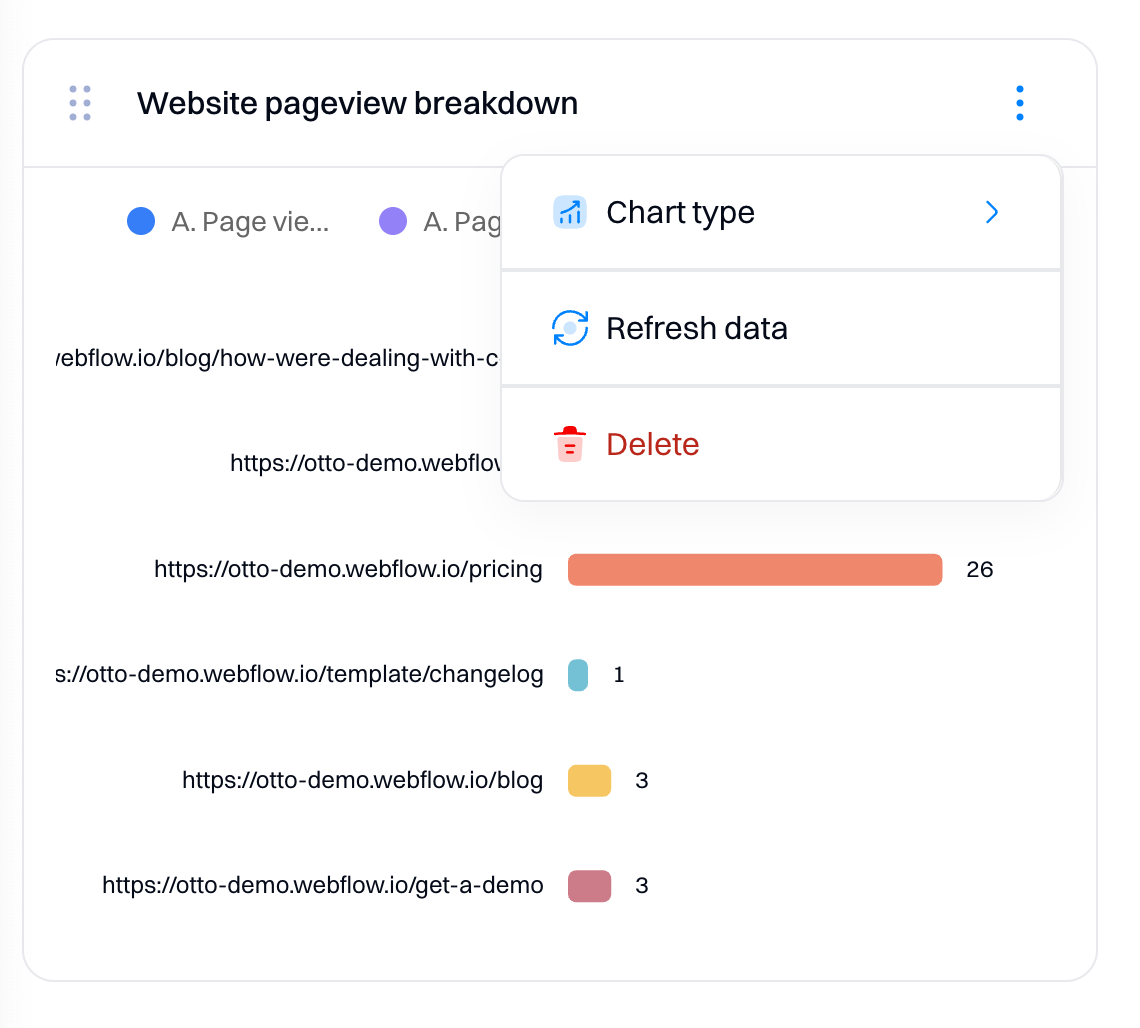
You can edit the dashboard by adding or removing the object. You can also drag and drop the dashboard blocks to change the layout. As for each block, you can:
- Change the chart type. This changes how the chart type is displayed in the dashboard. Remember that it does not affect how the chart is displayed in the source report.
- Refresh data. Refreshes the specific report with the latest data.
- Delete. Deletes the report from the dashboard. Remember that it does not remove the source report from the project - just from the dashboard.
Resizing the layout
You can change the layout of the dashboard by dragging and dropping the individual elements at the top right corner of the objects. Dashboards can also be resized horizontally and vertically.
Refresh
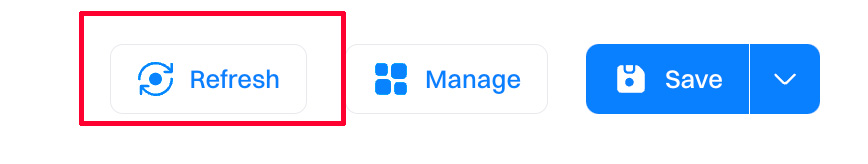
Dashboards do not update in real-time - select "Refresh" to get an updated version of your data visualization.
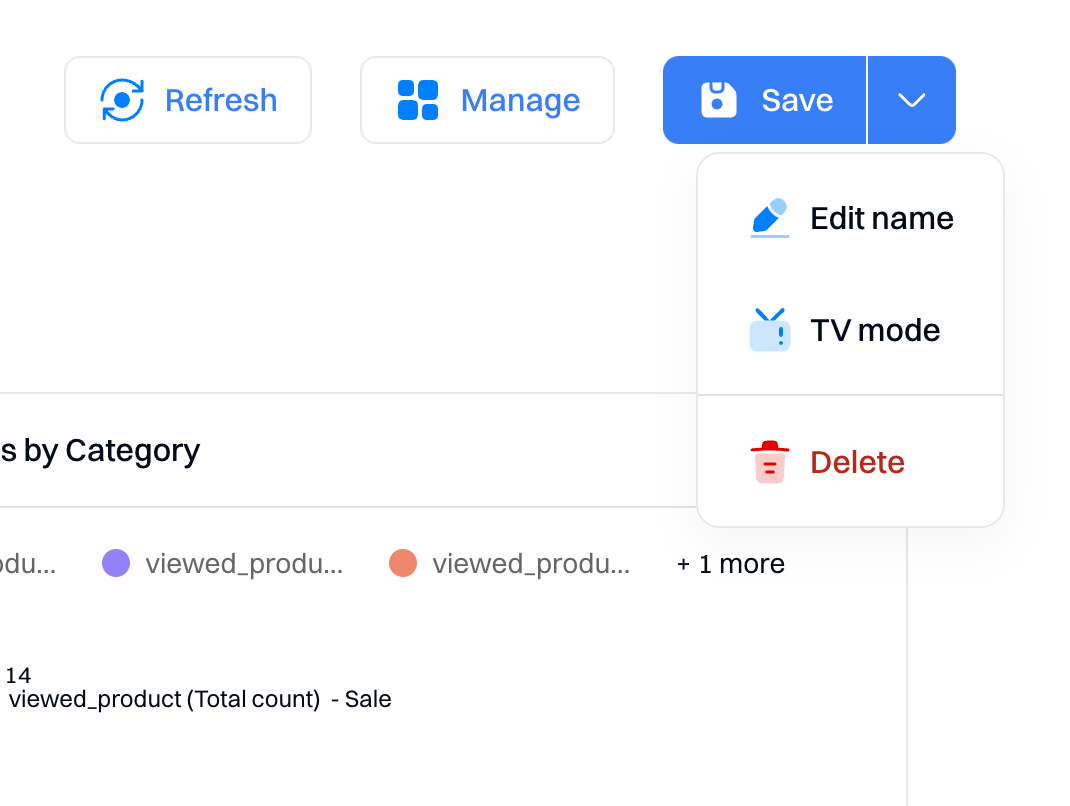
TV mode
TV mode is a full-screen mode for the dashboard, which can be accessed via the "Save" button dropdown.
Updated 2 months ago