
Managing the likelihood model
Overview
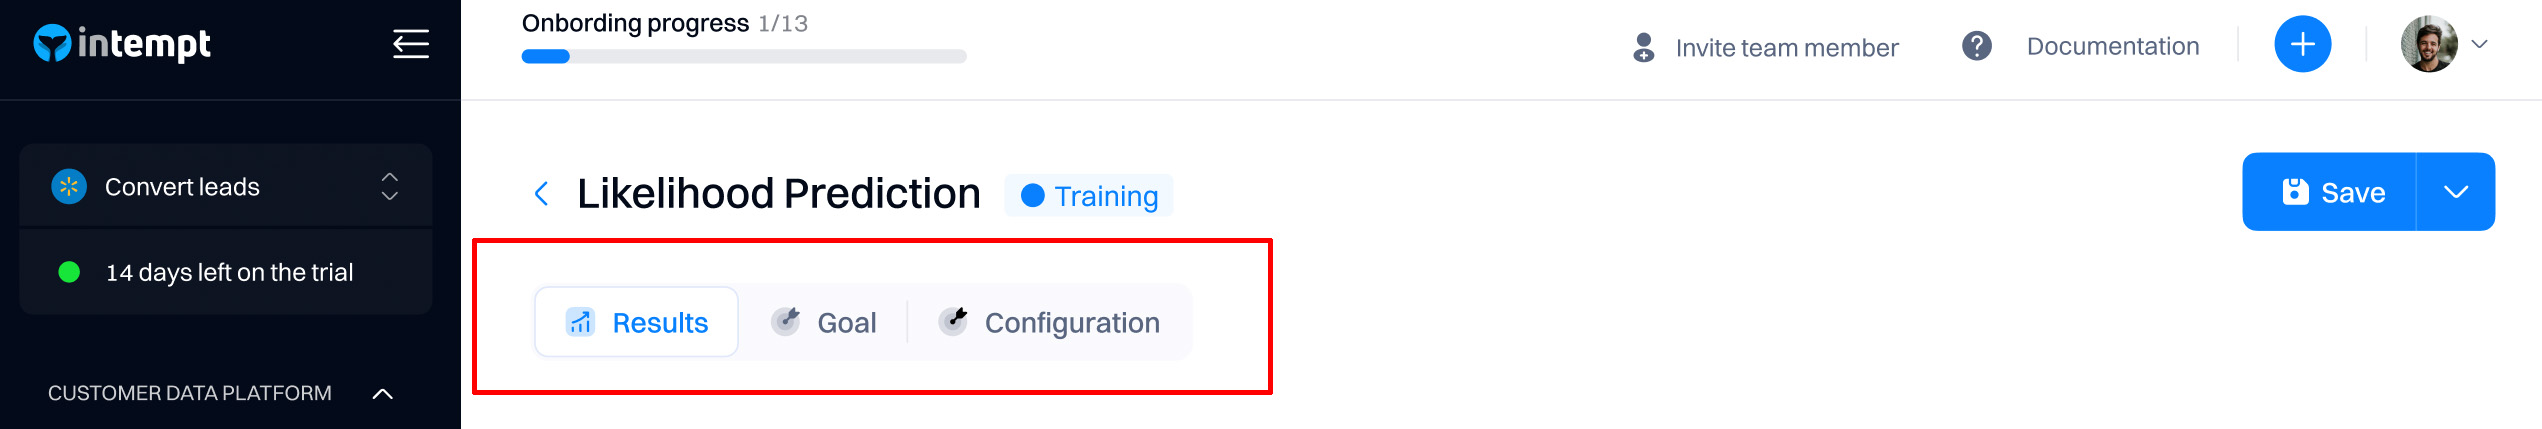
After the model is created, you can navigate through these tabs:
- Results. Review the model's results and prediction quality
- Goal. Edit the configuration of the goal event
- Configuration. Change the training timeframe and user inclusion (filters)
Good to know
For editing Goal and configuration sections, refer to Creating a likelihood model.
Results
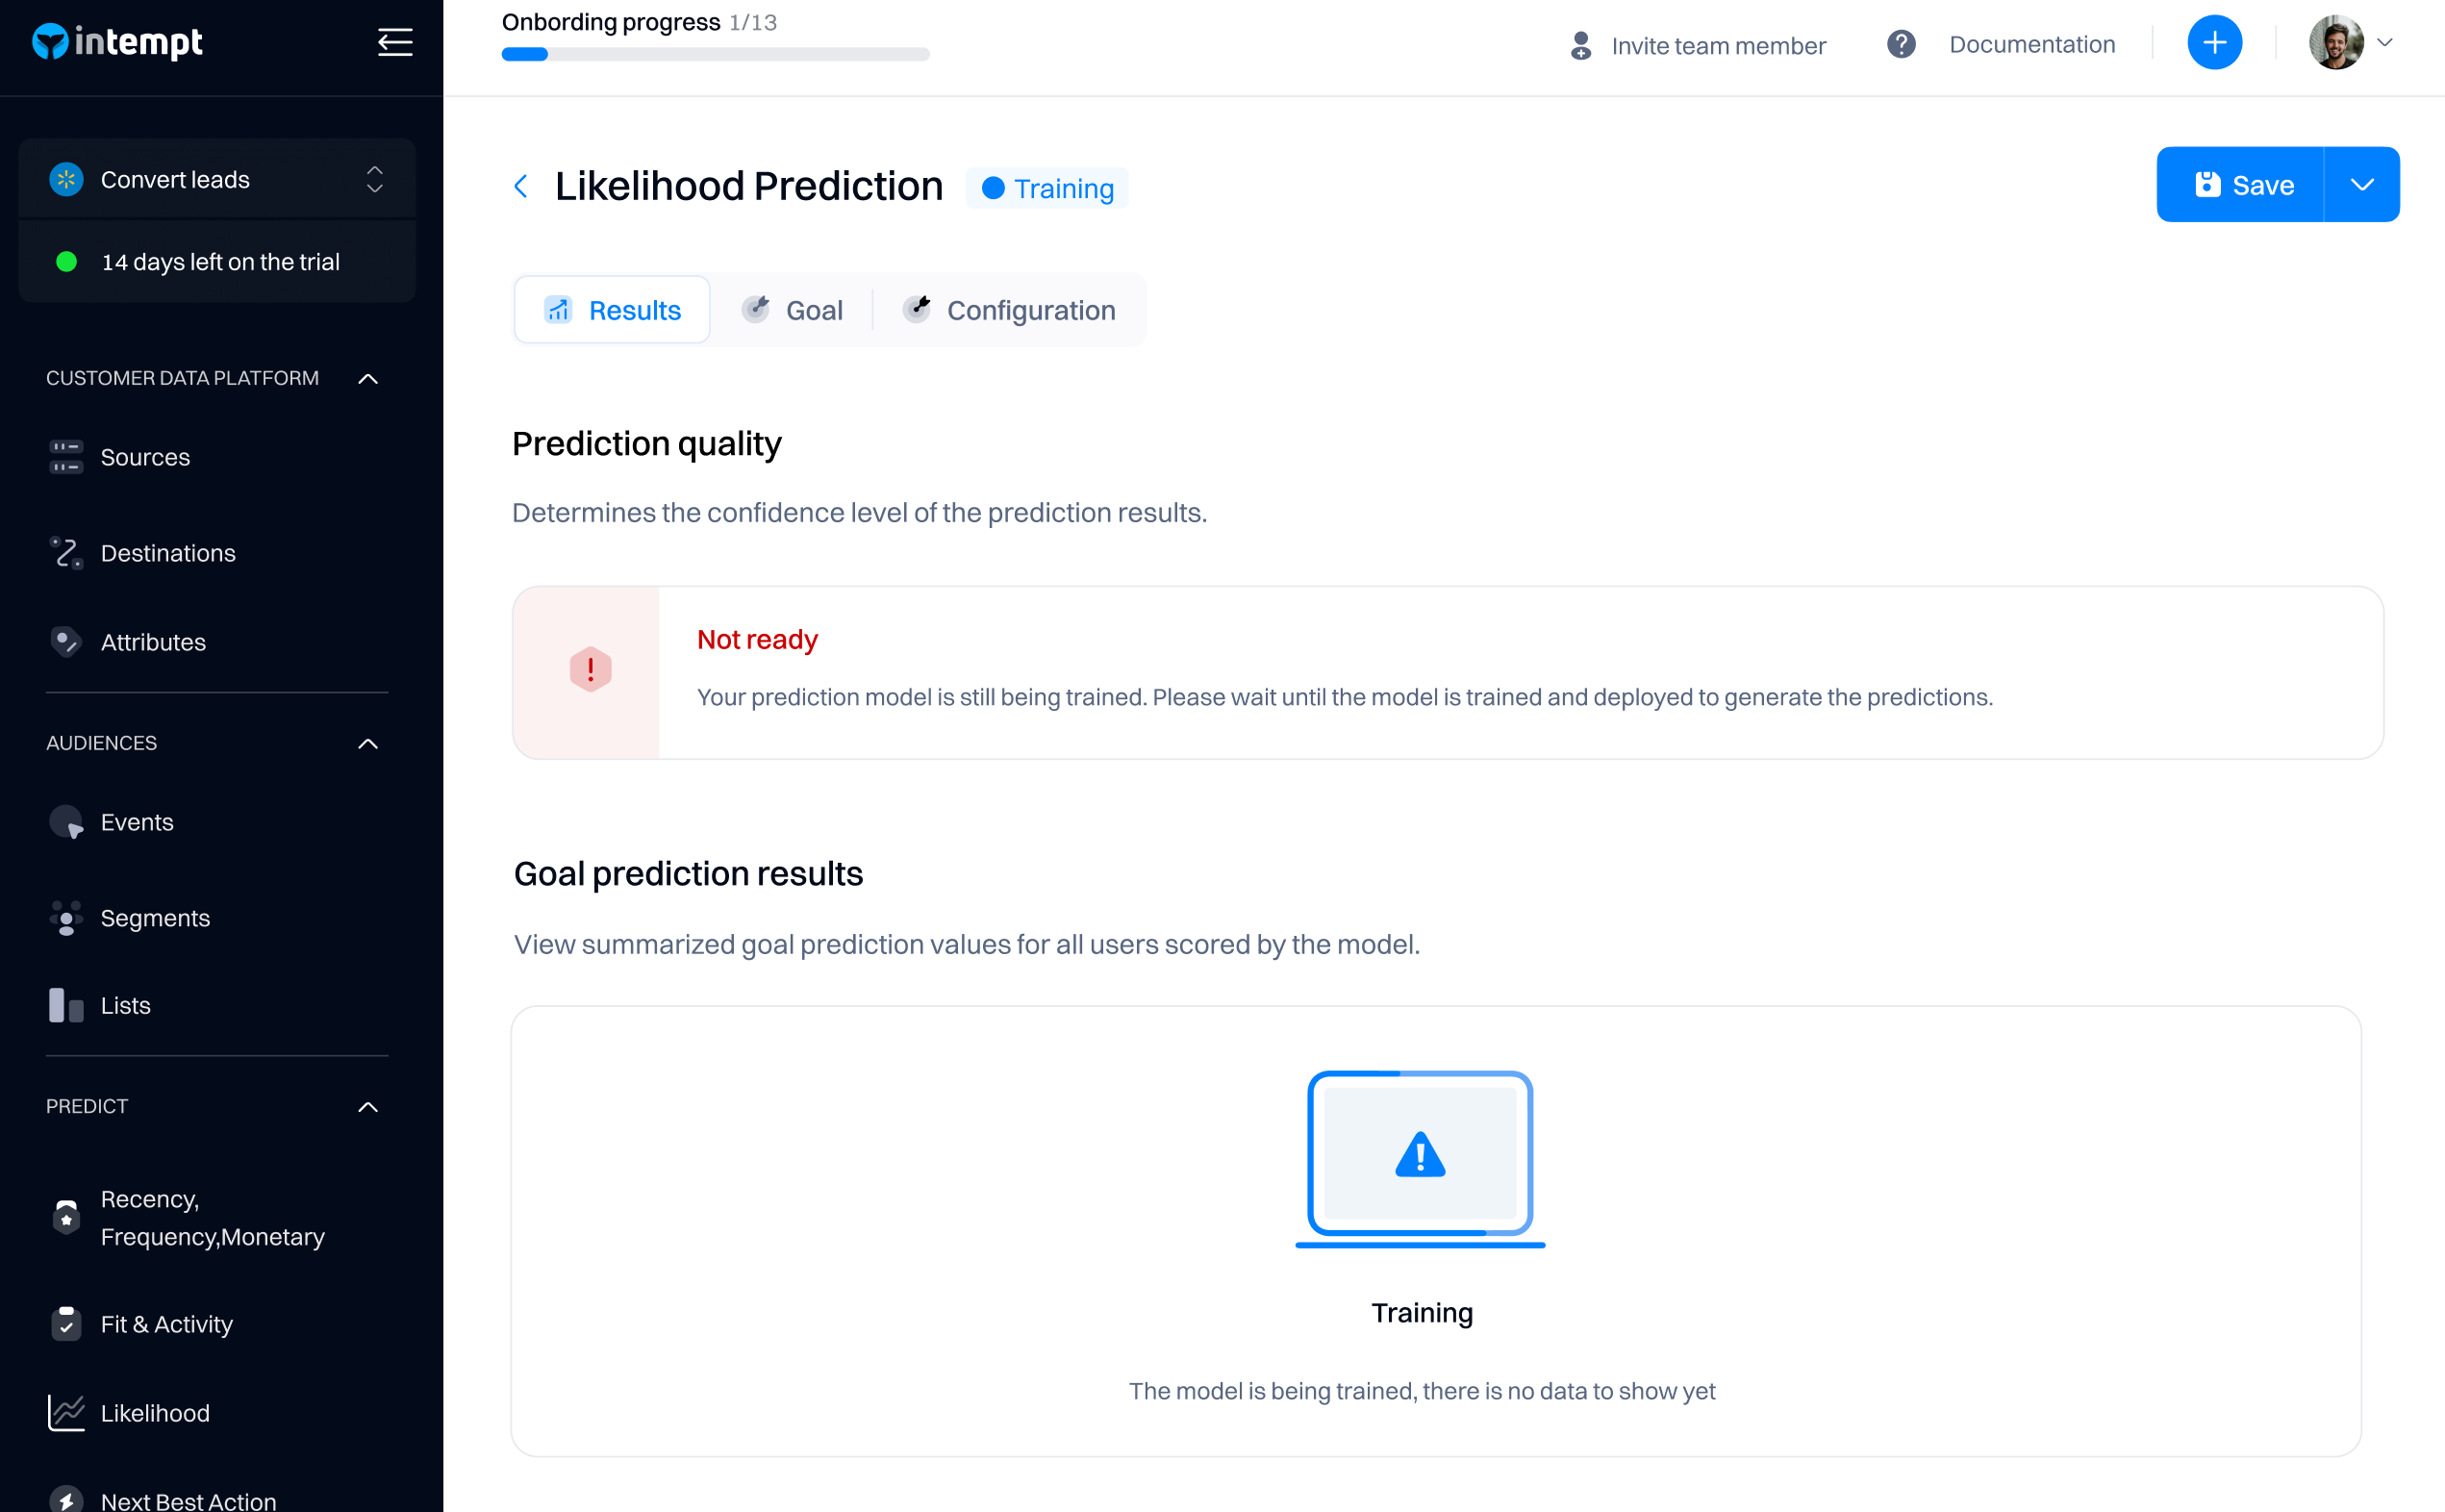
The results tab will display your model's prediction results.
After creating the model, you must wait until the training is completed—depending on the database size, it may take up to 30-60 minutes.
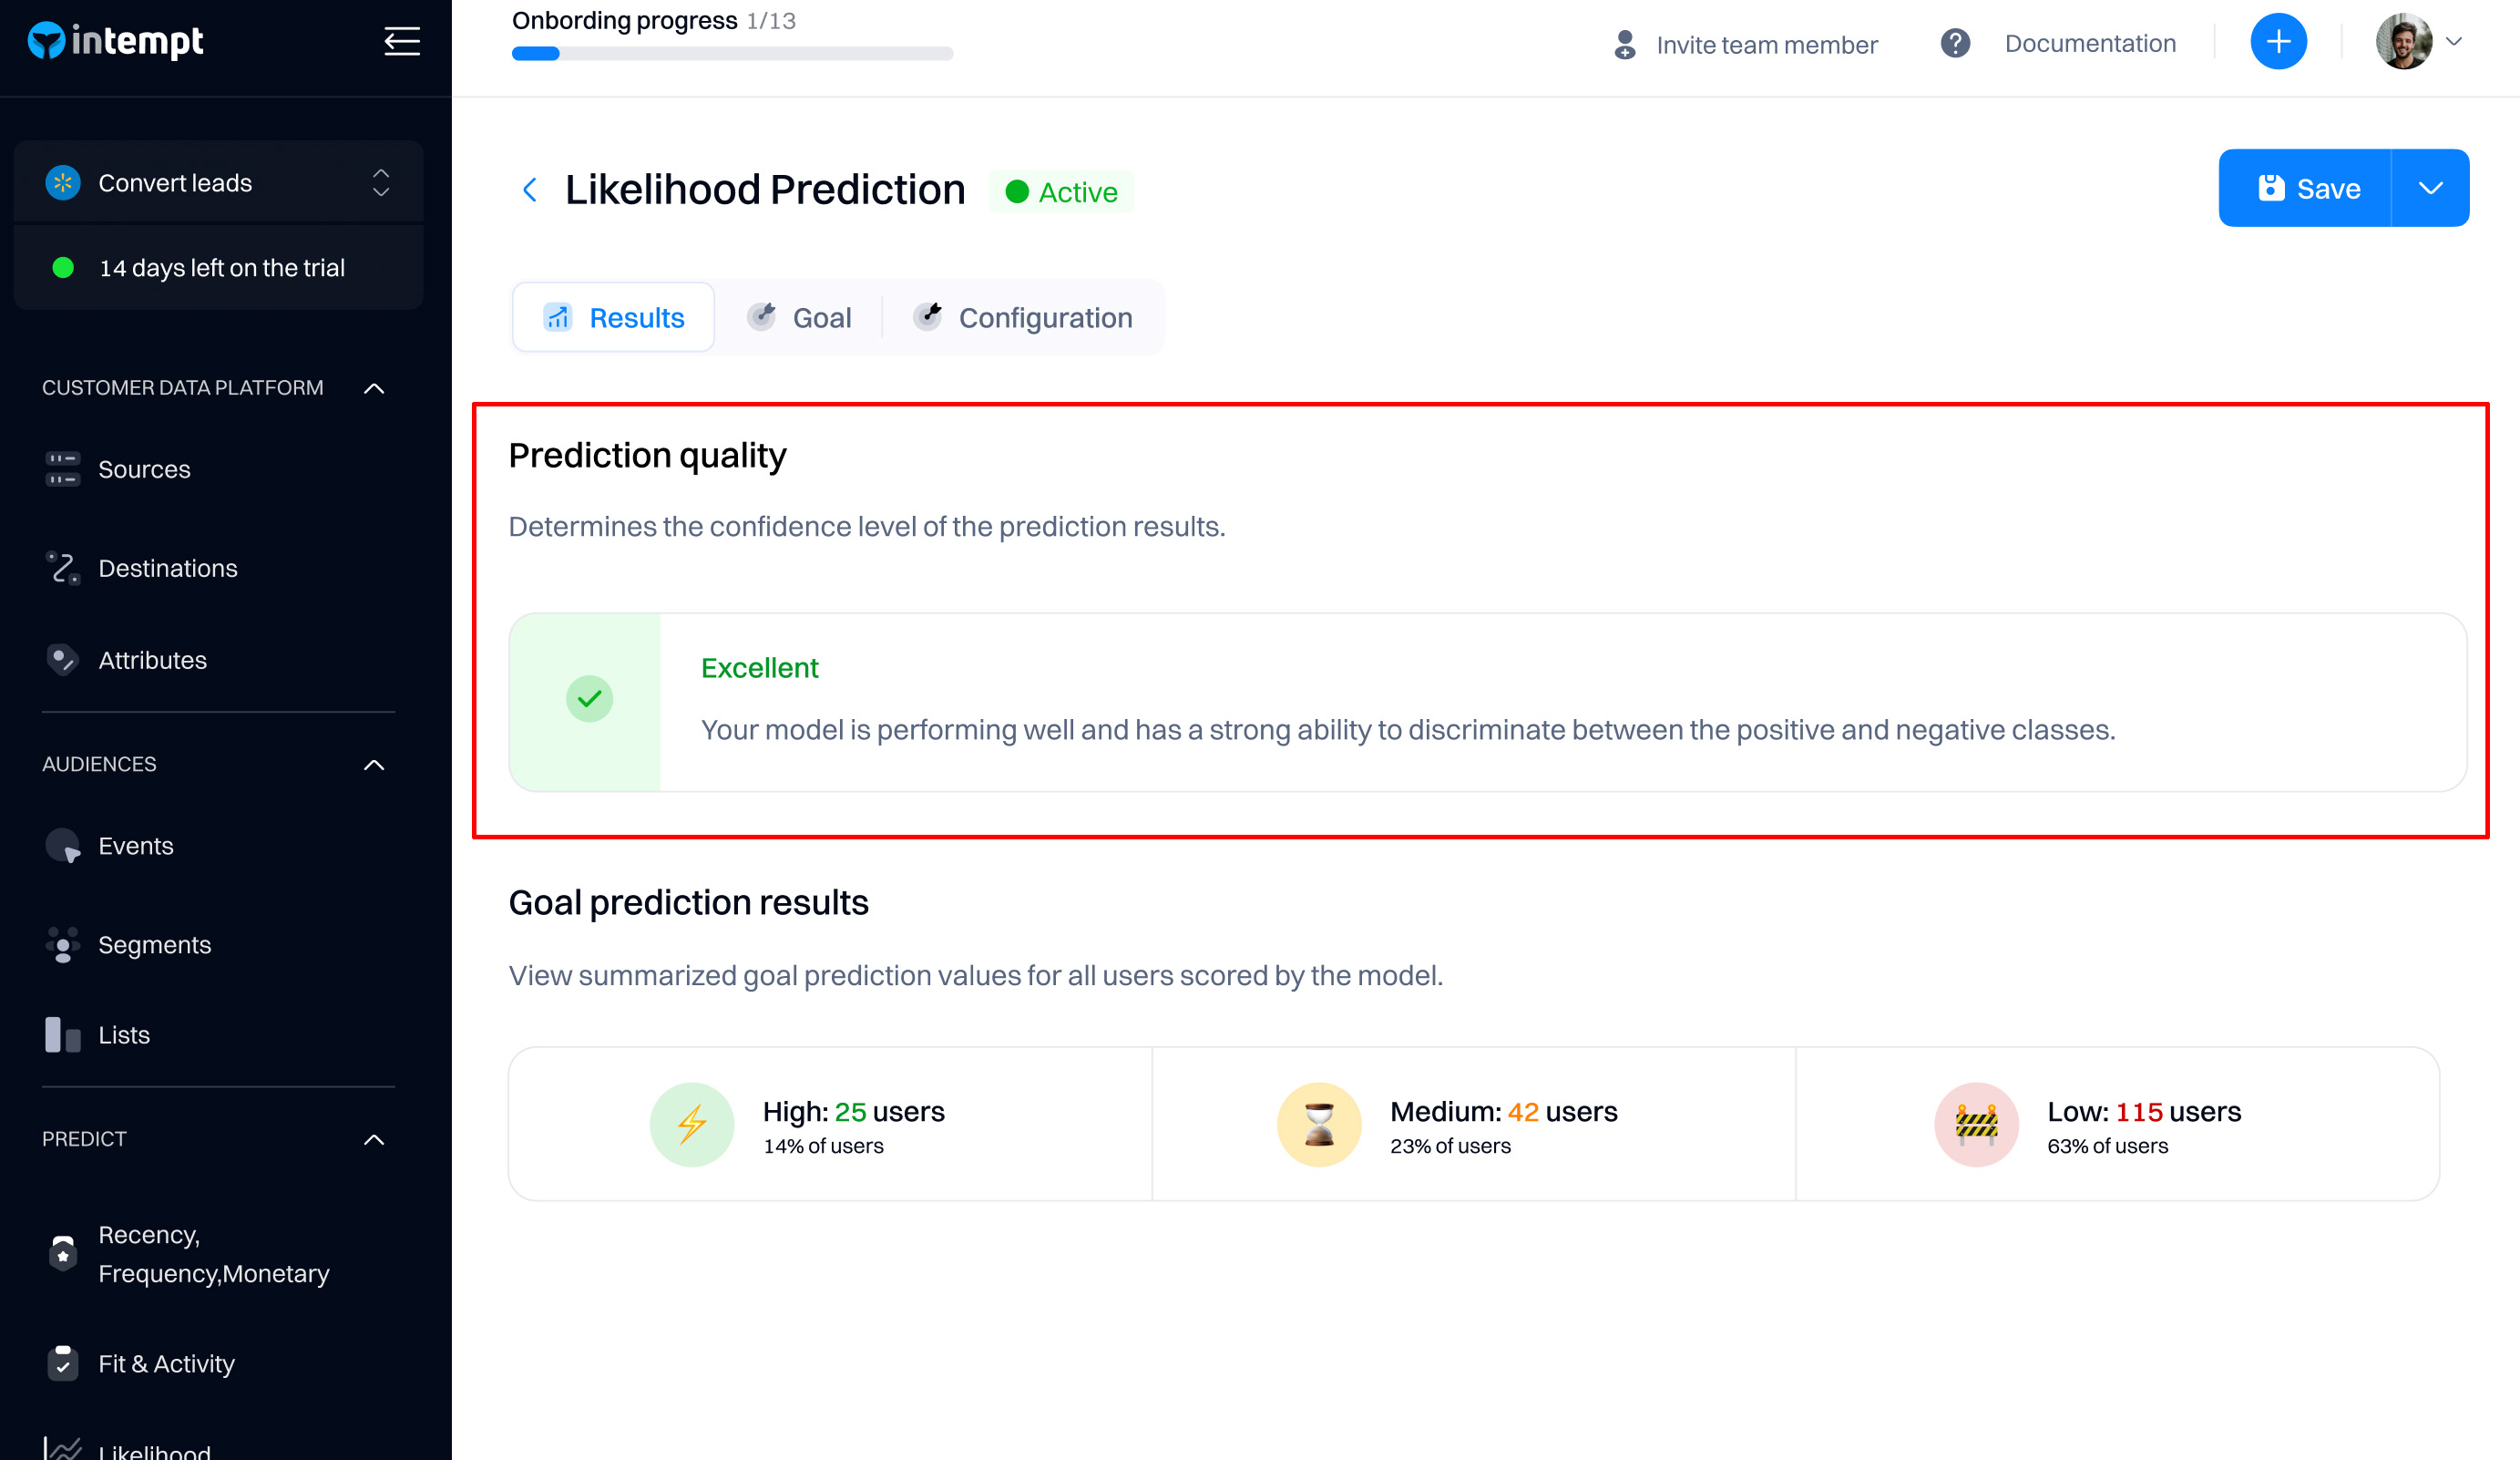
Prediction quality
Prediction quality indicates if the model is ready to be used in targeting.
The quality of any AI model created in Intempt varies depending on several factors, including (but not limited to) the following:
- Data items that comprise the dataset and how complete of a picture the combined attributes provide.
- The daily volume of users and events in the dataset. A larger volume means more data is available for the model to learn from.
- The training date range. Training a model for a longer period generally equates to more data available for the model to learn.
To understand whether a given model is high-quality for use in the real world, you can use Intempt's recommendations, which are generated depending on the model's AUC.
Good to know
AUC (or AUROC, short for Area Under the Receiver Operating Characteristics curve) is one of the most commonly used measures of performance for machine learning classifiers. It is represented as a percentage from 0-100%. The higher your pipeline’s AUC, the better its predictive power.
| Model quality | AUC | Explanation |
|---|---|---|
| Excellent | > 85% | Your scoring model performs exceptionally well regarding discrimination ability, effectively distinguishing between positive and negative cases, and has a high degree of predictive power. |
| Very Good | 75-85% | Your model performs well in terms of discrimination ability. It learns useful patterns from the data and effectively distinguishes between positive and negative cases. |
| Good | 65-75% | Your model has some discriminatory power but may not be performing at an optimal level. We recommend waiting until you gather more data or excluding some data items to improve the model performance. |
| Average | 55-65% | Your model has limited ability to distinguish between the positive and negative classes. It ranks a randomly chosen positive instance higher than a randomly chosen negative instance with a probability typically between 55% and 65% of the time. We recommend focusing on model improvement to enhance its predictive power by gathering more data or excluding some data items to improve the model performance. |
| Below Average | <55% | Your model has a very limited ability to distinguish between the positive and negative classes. It ranks a randomly chosen positive instance lower than a randomly chosen negative instance with a probability of less than 55% of the time. We recommend focusing on model improvement to enhance its predictive power by gathering more data or excluding some data items to improve the model performance. |
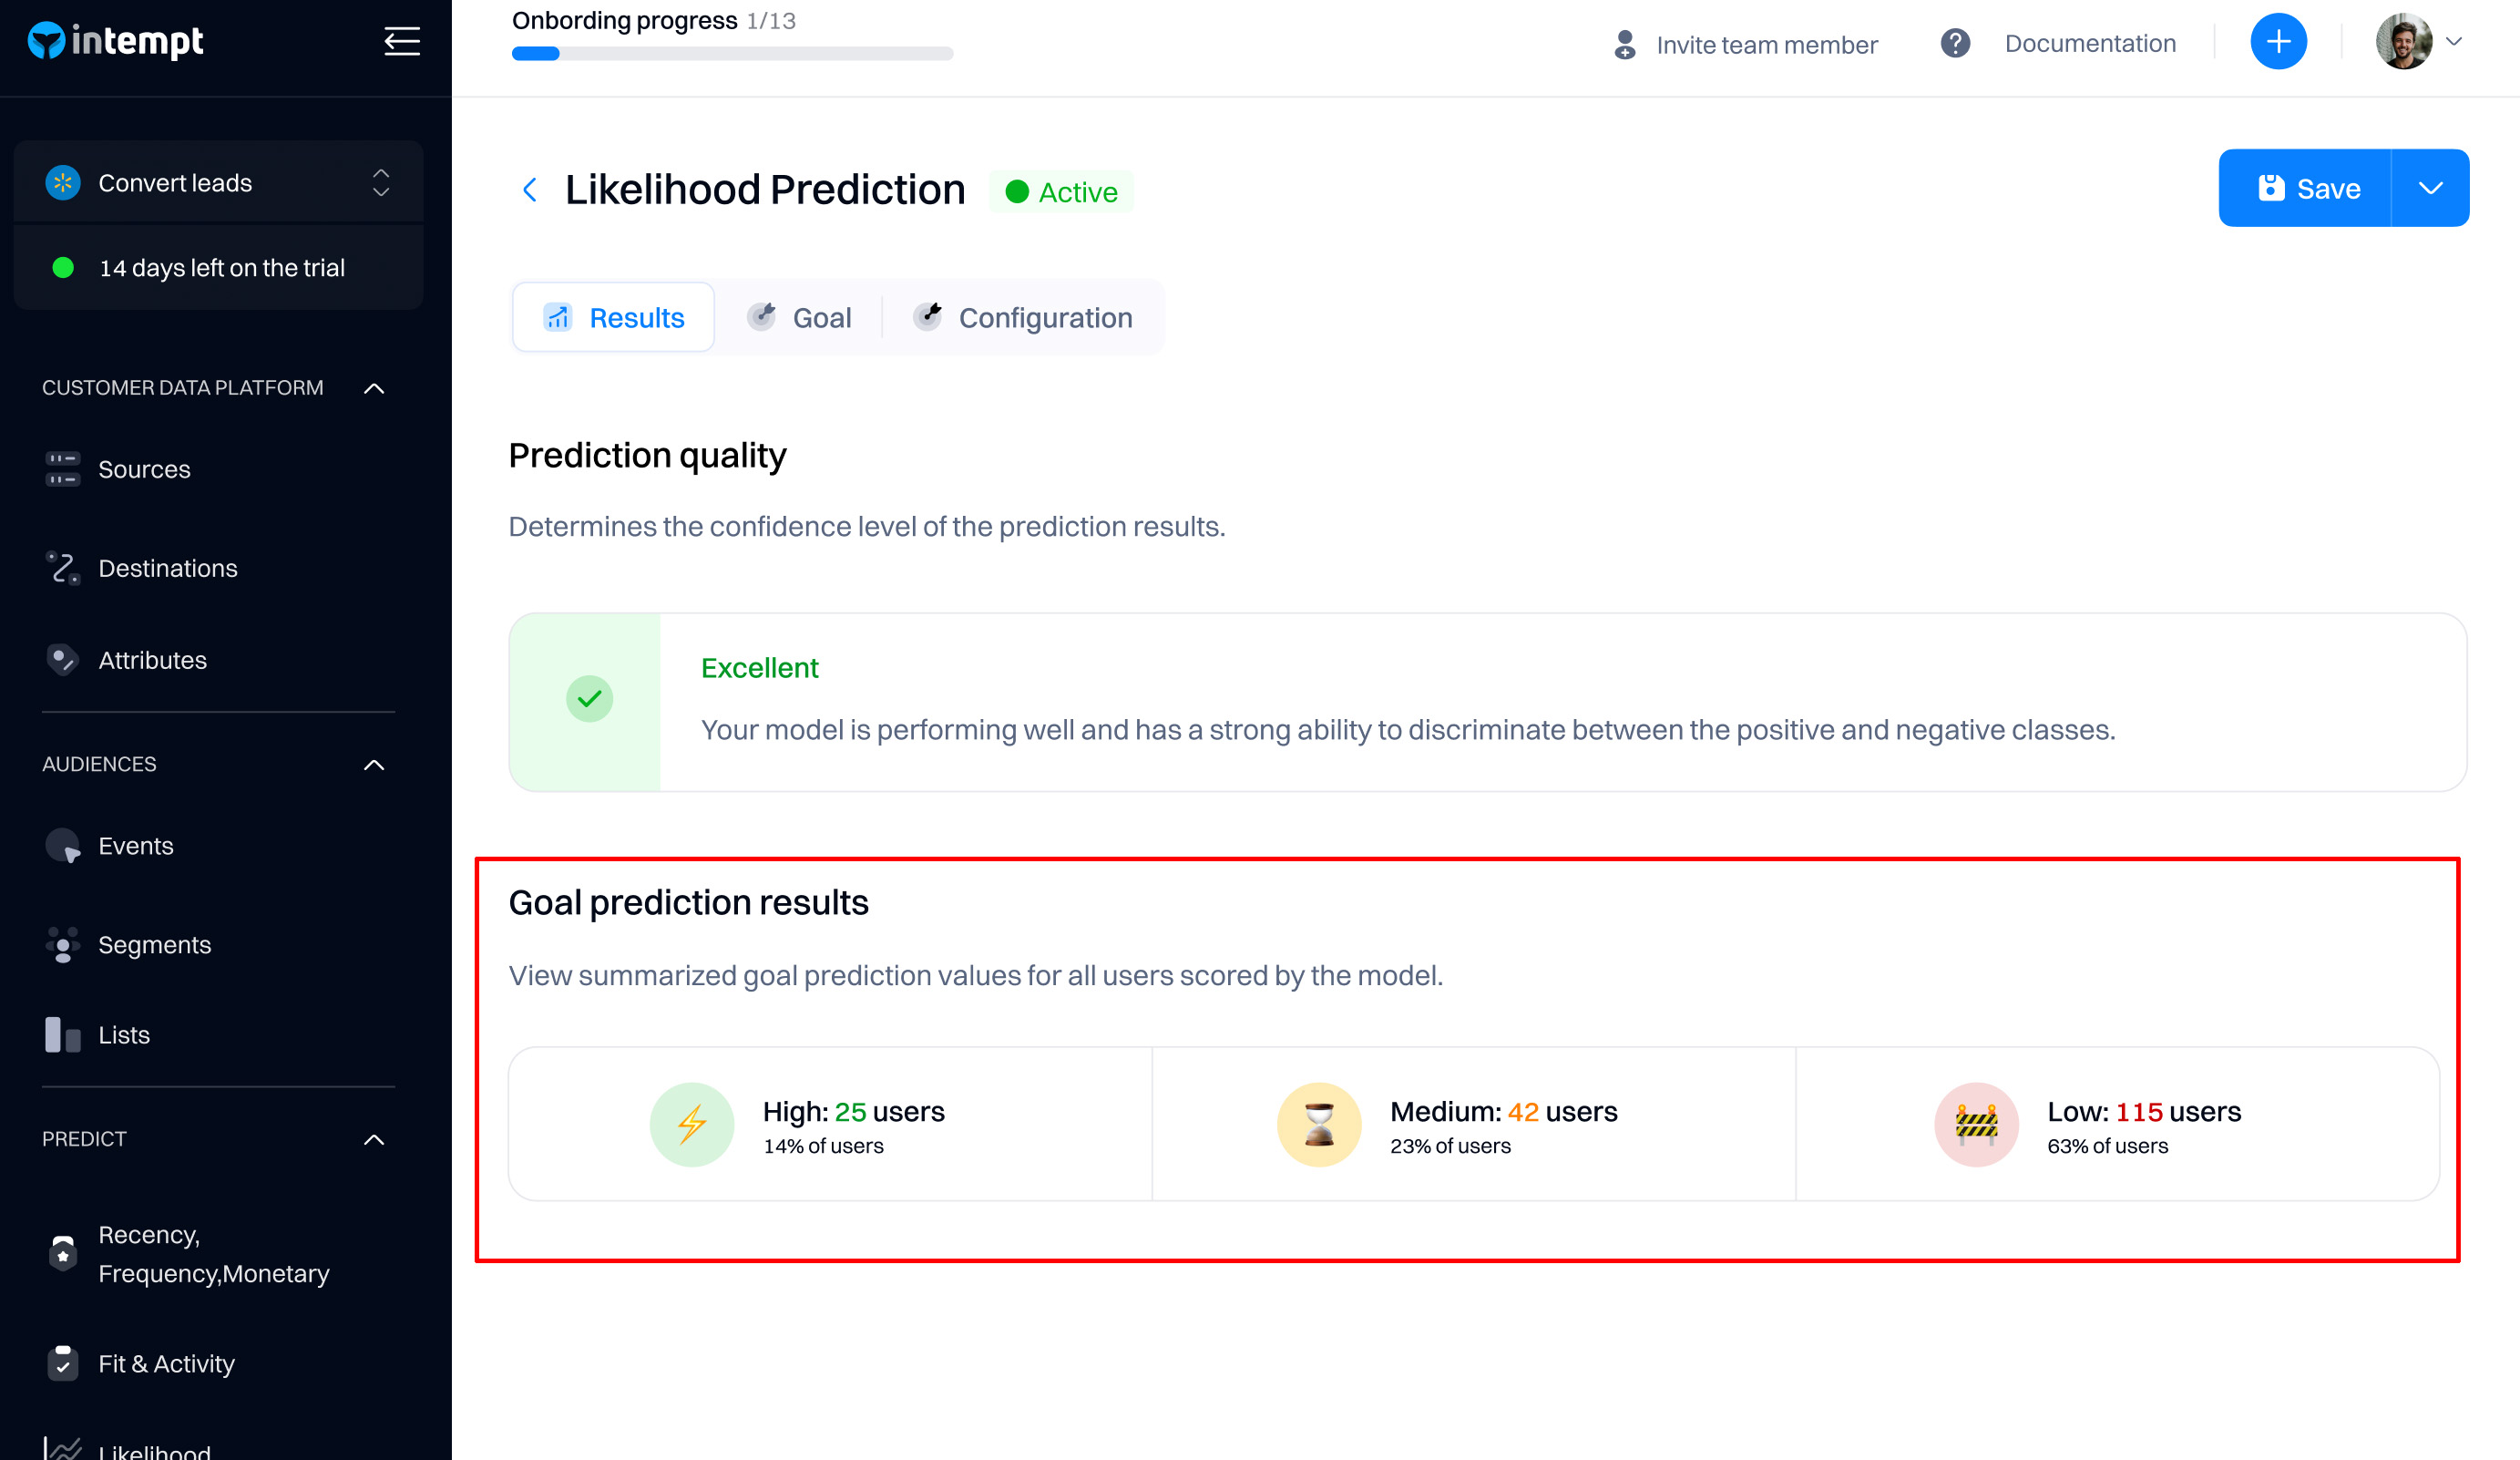
Goal prediction results
After the model finishes training and prediction, it will automatically divide users into 3 categories based on the likelihood of performing the event: low, medium, and high.
Low
Definition: Represents scores or predictions within the model's lowest range. This generally indicates a lower likelihood of the user performing the goal event.
Implications for use cases:
- Low Risk. Indicates a low likelihood of events such as fraud or churn.
- Low Priority. In lead scoring or customer engagement, suggests these users or items require less immediate attention.
- Low Impact. For models estimating impacts like marketing campaigns, indicates minimal impact.
Medium
Definition: Covers scores that fall between the lowest and highest extremes, typically indicating an intermediate level of the user performing the goal event.
Implications for use cases:
- Moderate Risk. Suggests a moderate likelihood of an event occurring, necessitating routine monitoring.
- Average Priority. Implies that while users or issues are stable, engagement could enhance or maintain their current status.
- Moderate Impact. Expected impacts are noteworthy but not extreme; appropriate for standard interventions.
High
Definition. Includes the highest scores indicating the highest likelihood, severity, or priority.
Implications for Users:
- High Risk. Suggests a high likelihood of occurrence, requiring immediate action to mitigate potential outcomes.
- High Priority. In customer service or sales, indicates critical issues or opportunities needing immediate attention.
- High Impact. Actions or changes will likely have a substantial effect.
Good to know
The dividing users into low, medium, high buckets is dynamic. The indicates scoring categories might shift based on the model’s design and data inputs.
Using the likelihood model for targeting
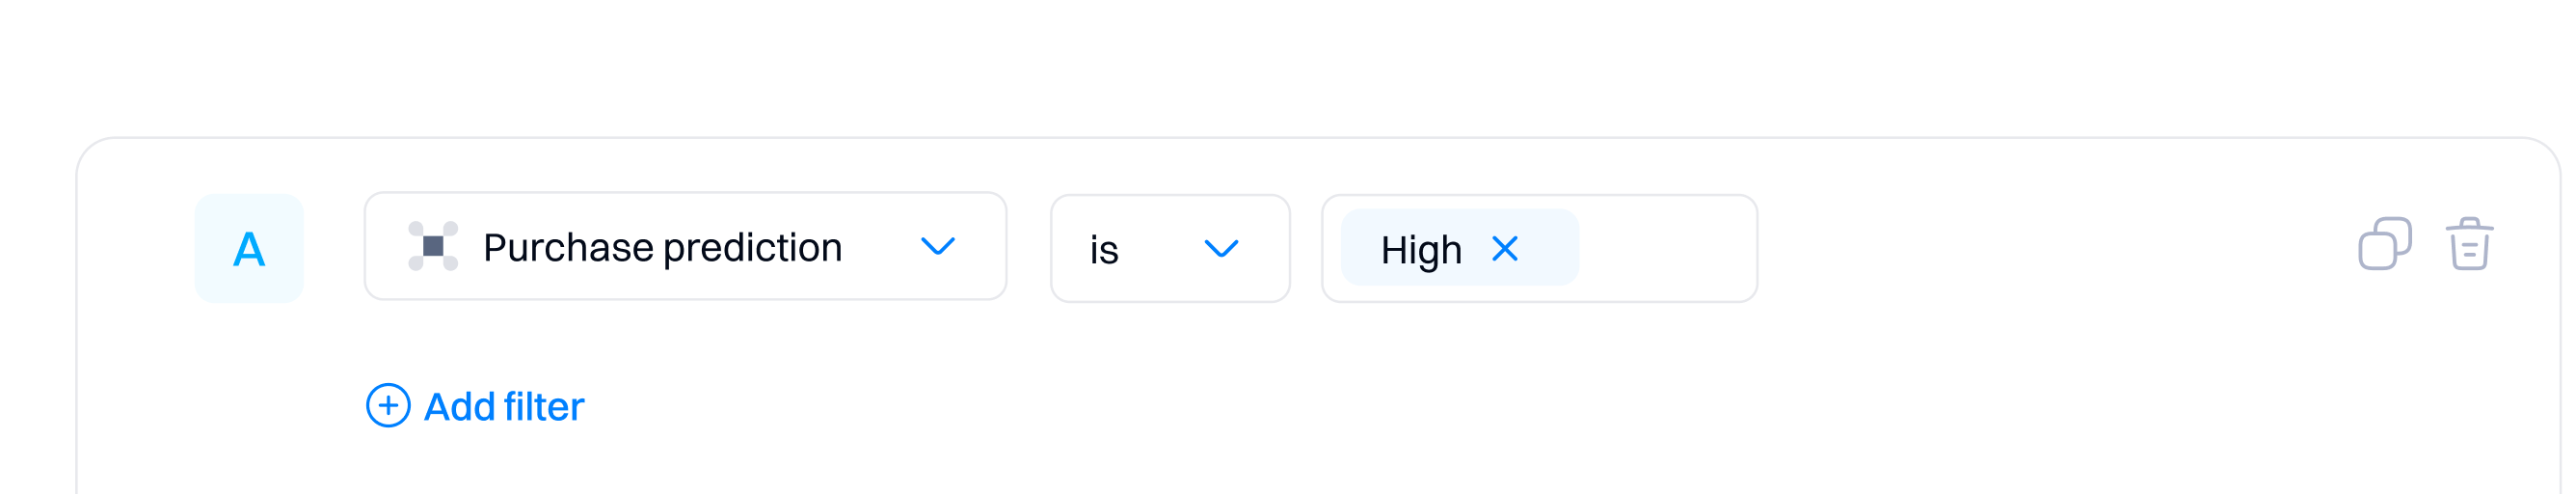
After creating the model, it will appear in the targeting dropdowns that support using calculated attributes (e.g., segment editor, personalizations, journey triggers, etc.).
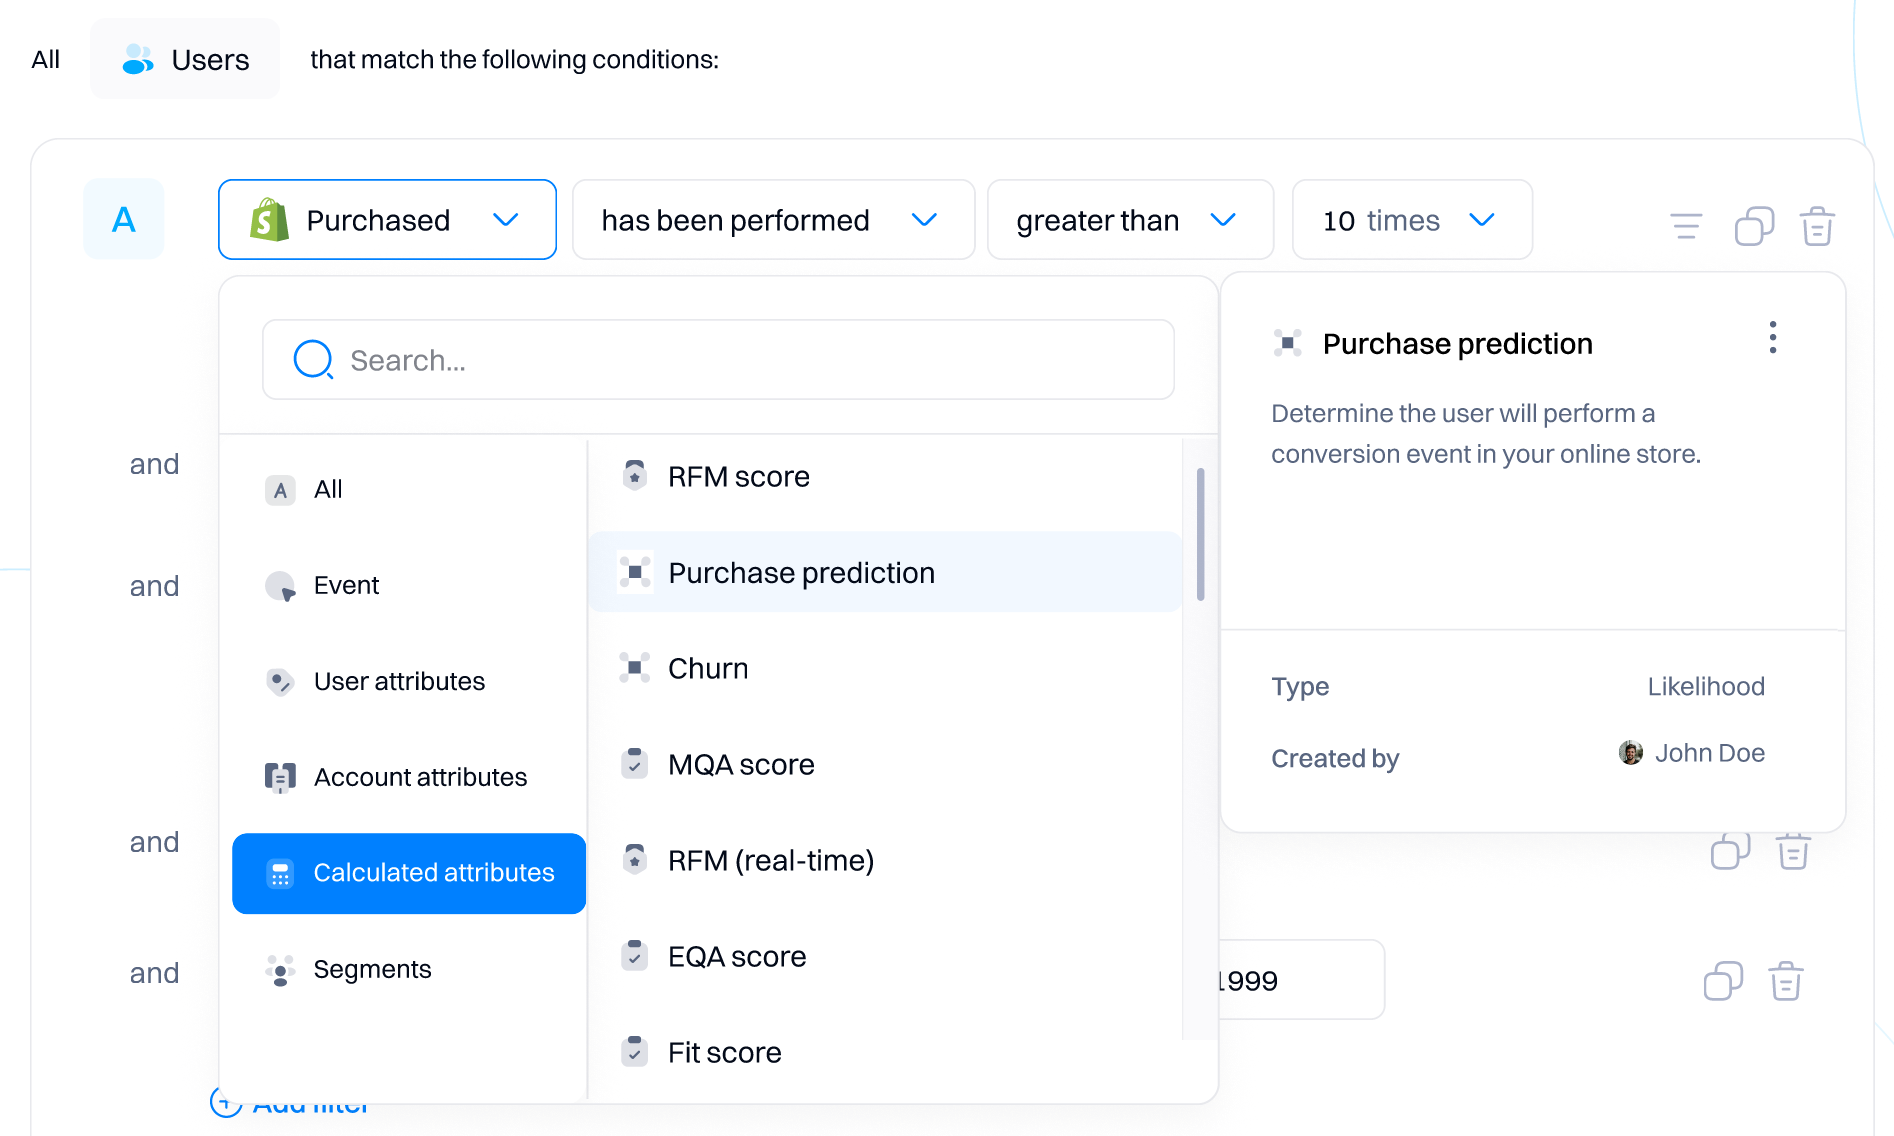
After selecting the relevant likelihood model, you will be able to select its condition based on the available values: low, medium and high.
Updated 7 months ago