
Client-side experiments
Client-side experiments allow you to create A/B testing campaigns using a simple Javascript snippet and no-code visual editor.
This enables marketers to marketers to independently execute A/B tests with more ease and less technical dependency. It provides an intuitive interface, making setting up and managing A/B tests for your website simple and allowing for quicker iteration and adaptation in marketing strategies.
You can experiment with elements like styling, text content, calls to action, and even inject scripts that change the page's behavior.
Key terms
- Client-side experiment. Client-side testing is the experimentation process of rendering variations at the browser level. When a user visits a webpage on a browser, it initiates a request to the server, which sends the required file to the browser. The browser then processes the file and displays the webpage. The interactive elements of the webpage are made possible through the use of JavaScript within the files.
- Control . Represents the current state of affairs—the “business as usual” or the standard user experience, without any new changes applied. It’s what you measure new variants against to understand the impact of the changes you are testing.
- A Variant is a product or feature experience being tested, often by assigning values to control variables. In simple A/B experiments, A and B are two variants, usually called Control and Treatment.
- Statistical Significance can be assessed using multiple approaches. Two of these approaches are using the p-value and the confidence interval:
- The p-value measures the probability of the metric lift you observe (or a more extreme lift) assuming that the variant you’re testing has no effect. The standard is to use a p-value less than 0.05 to identify variants that have a statistically significant effect. A p-value less than 0.05 implies that there’s less than 5% chance of seeing the observed metric lift (or a more extreme metric lift) if the variant had no effect. In practice, a p-value that's lower than your pre-defined threshold is treated as evidence for there being a true effect.
- A confidence interval examines whether the metric difference between the variant and control overlaps with zero. A 95% confidence interval is the range that covers the true difference 95% of the time. It is usually centered around the observed delta between the variant and control with an extension of 1.96 standard errors on each side.
Advantages of client-side testing
| Title | Description |
|---|---|
| Easy to adopt | Client-side A/B testing tools like Intempt offer a WYSIWYG (visual editor), which doesn’t require coding to create variations. Such testing frameworks make it easy to adopt client-side testing, especially if the company is small and can’t afford a development tea |
| Low investment cost | It requires less financial investment compared to server-side testing. Client-side testing is a preferred mode of experimentation for businesses on a budget crunch or new to optimization. |
| Ability to test often | Client-side testing allows intuitive tools to create variations, making it easy for the CRO team to create variations frequently and test more hypotheses. |
Limitations of client-side testing
| Title | Description |
|---|---|
| May reduce the website speed | The JavaScript runs at the browser level, which increases the LCP (Longest contentful paint) time compared to server-side rendering. |
| Limited to UI/UX testing | JavaScript runs at the browser's end, which is why the scope of experimentation is limited. Complex experimentation, like a product search algorithm test, is not feasible with client-side testing. Thus, complex and dynamic experimentation is possible only via server-side testing. |
| Cannot run omnichannel experiments | Client-side tests cannot run on the web and app at the same time. For omnichannel experiments, Server-side experiments are suitable. |
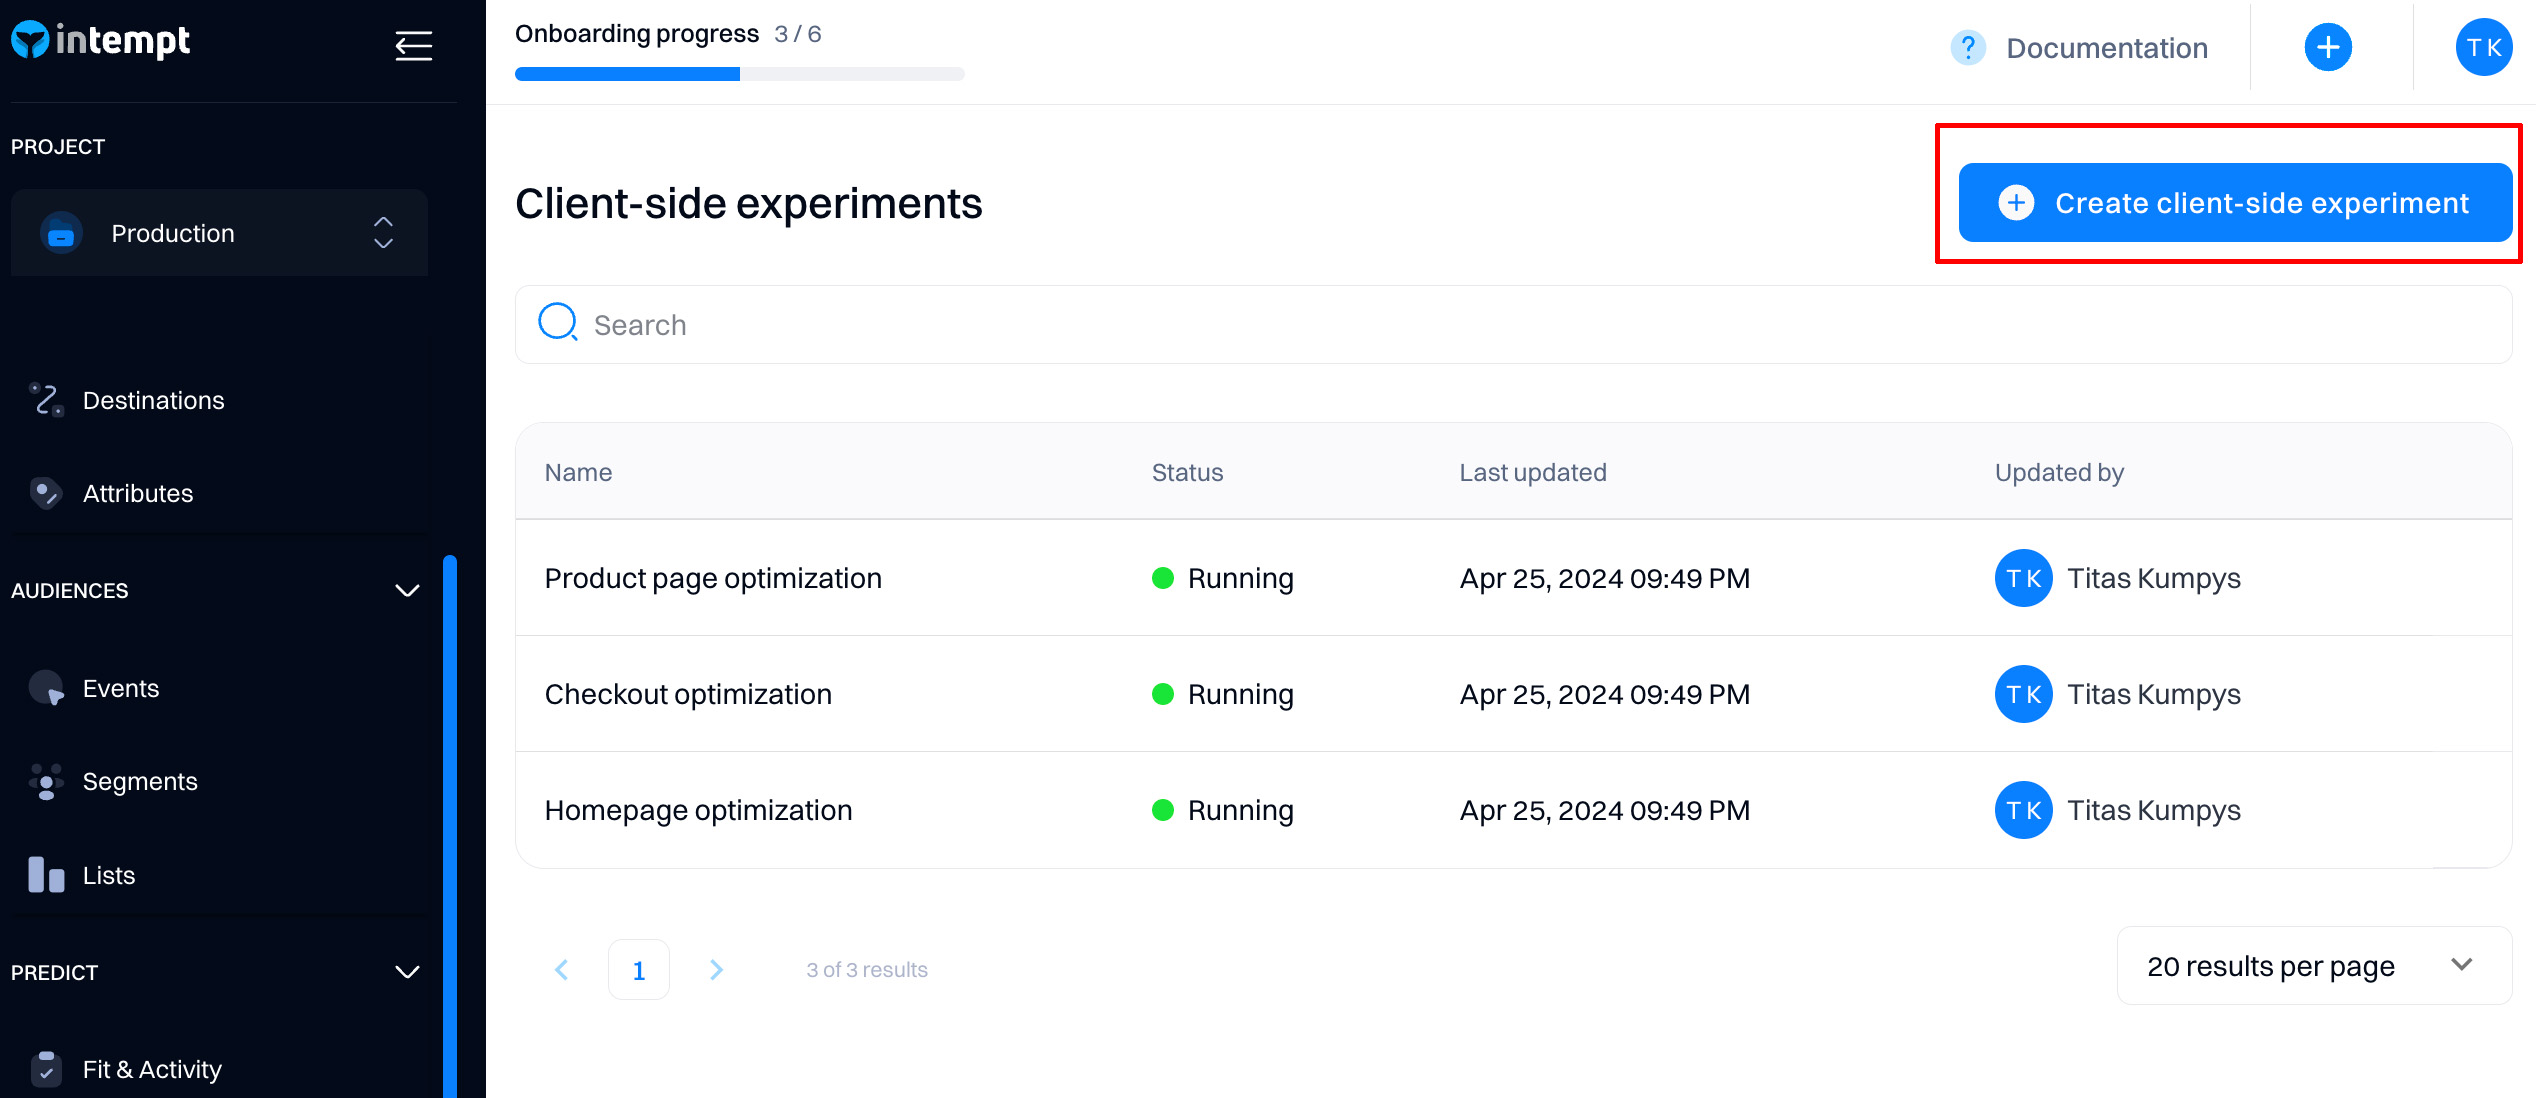
Creating an experiment
To create a personalization, go to Client-side experiment > Create client-side experiment
Enter name and target page URL
Name your experiment based on the type of test you are creating. For example, if you want to test different home page hero variations, you might name it “Hero banner A/B test.”
Select the Target page - URL where the personalization will be served by default. This will be your starting page, where you will create your first variant. Later, you can configure individual target URLs for each variant.
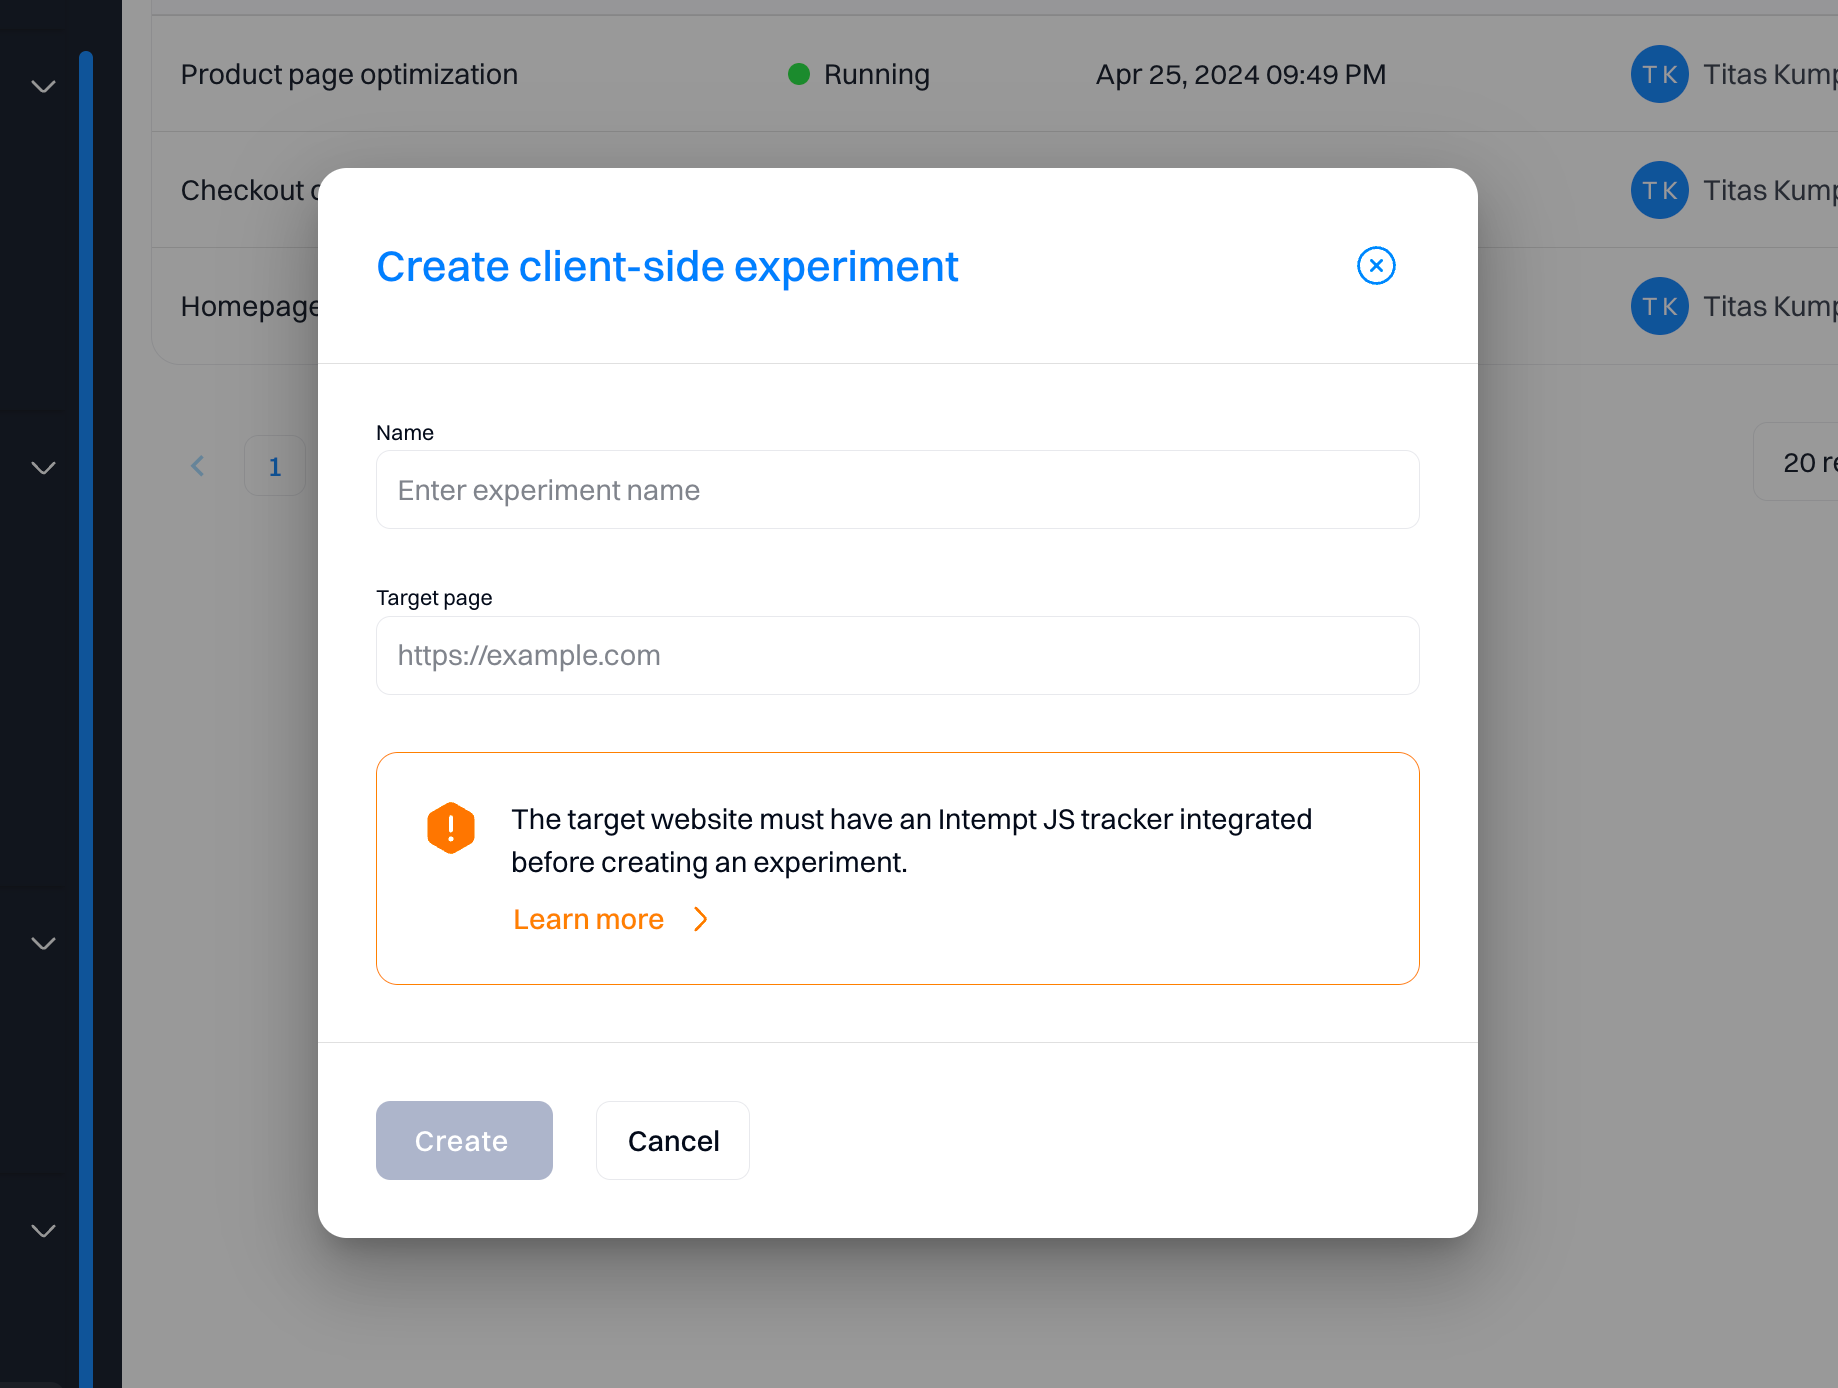
Attention
Ensure that you have Intempt Javascript SDKinstalled on your site before proceeding creating the experiment.
Create A/B test variants
You will be redirected to your target page, where you can set up the variants you want to create using the visual editor.
For a detailed guide on using the visual editor, visit Using the visual editor
Once you are done with the changes, click “Next” to proceed.

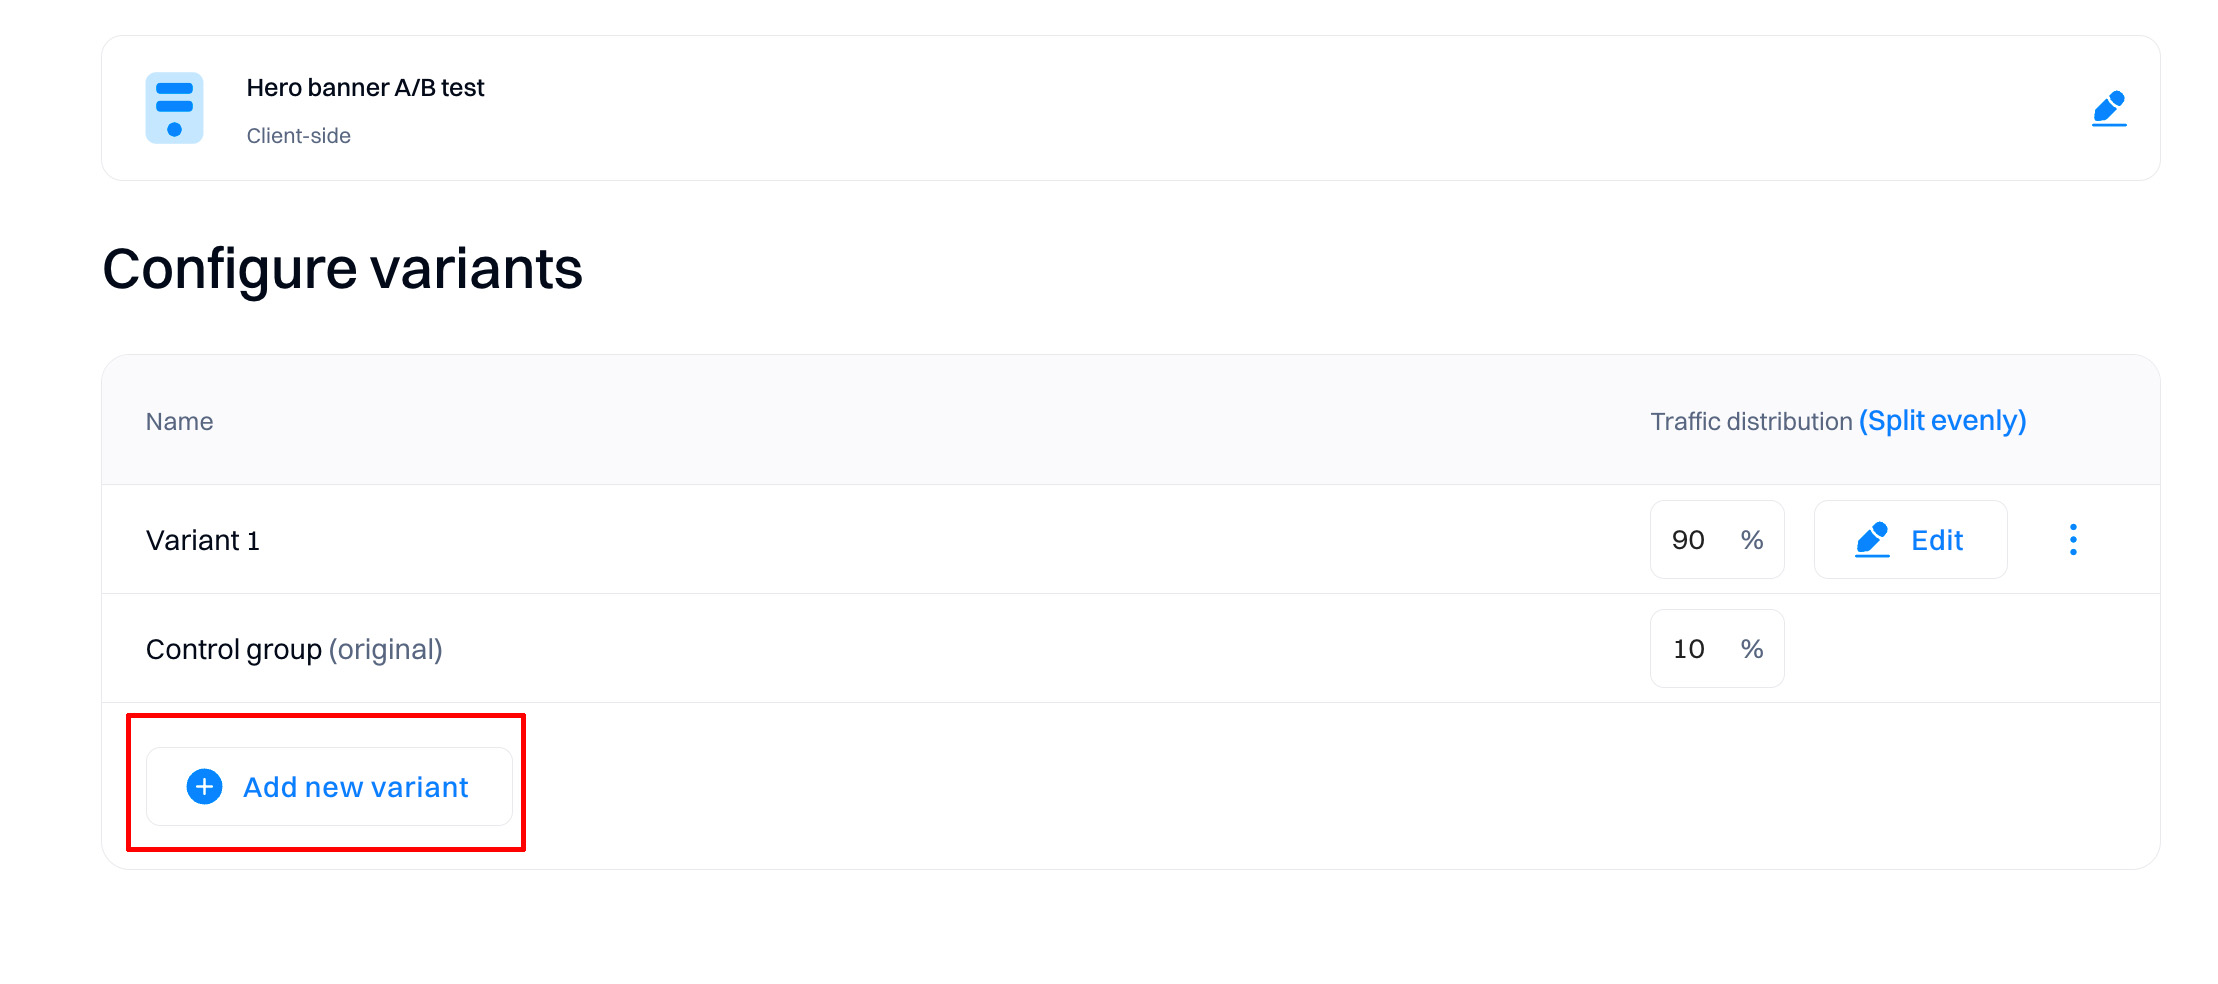
Add and configure new variants
You can create or edit new variants from the configuration screen. When you add a new variant, you are always redirected to the visual editor to configure the visual changes for your test.
Configure traffic distribution
Traffic distribution means the proportion of traffic sent to a particular variation.
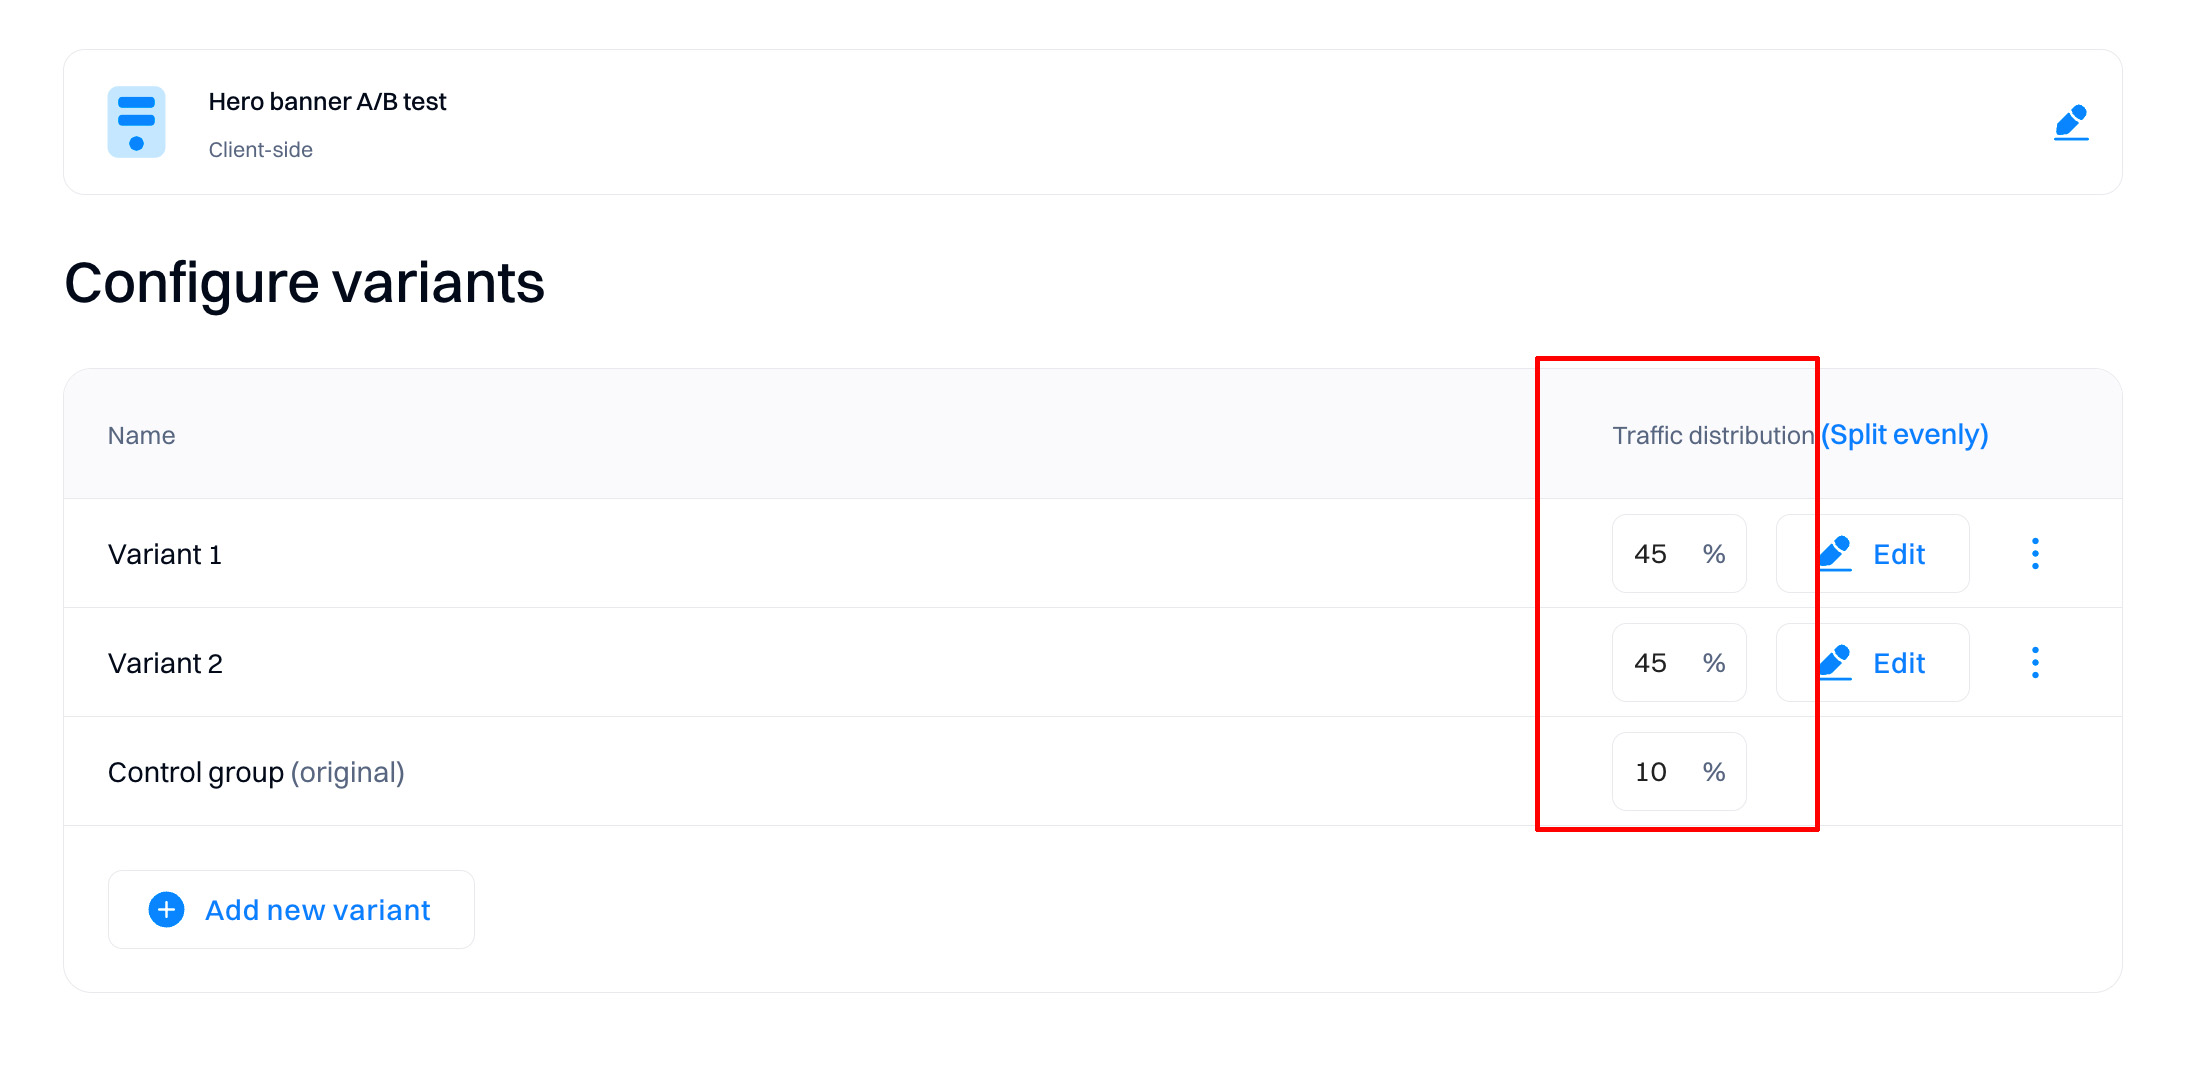
You can adjust the percentage of traffic bucketed into a particular variation. For example, if you have four variations and the traffic is distributed equally, each new visitor has a 25% chance of being placed into each variation.
Changes to traffic distribution affect only new users. Existing users (whether they were bucketed in a variation) keep seeing the same variation, even after you change traffic distribution. Users who are excluded from the experiment are always excluded.
However, stopping variations completely can potentially affect all users. If, for example, you stop a variation in an experiment, returning visitors who were previously bucketed into an experiment cannot see the variation to which they had been assigned and instead get the same experience as everyone else.
Good to know
The sum of traffic distribution always need to be equal to 100% for the experiment to be created correctly.
Configure the experiment scorecard
When running an experiment, it is common to try to test an explicit hypothesis, which you are measuring using a set of key metrics. The scorecard makes this easy, with the ability to enter your hypothesis and primary and secondary metrics.
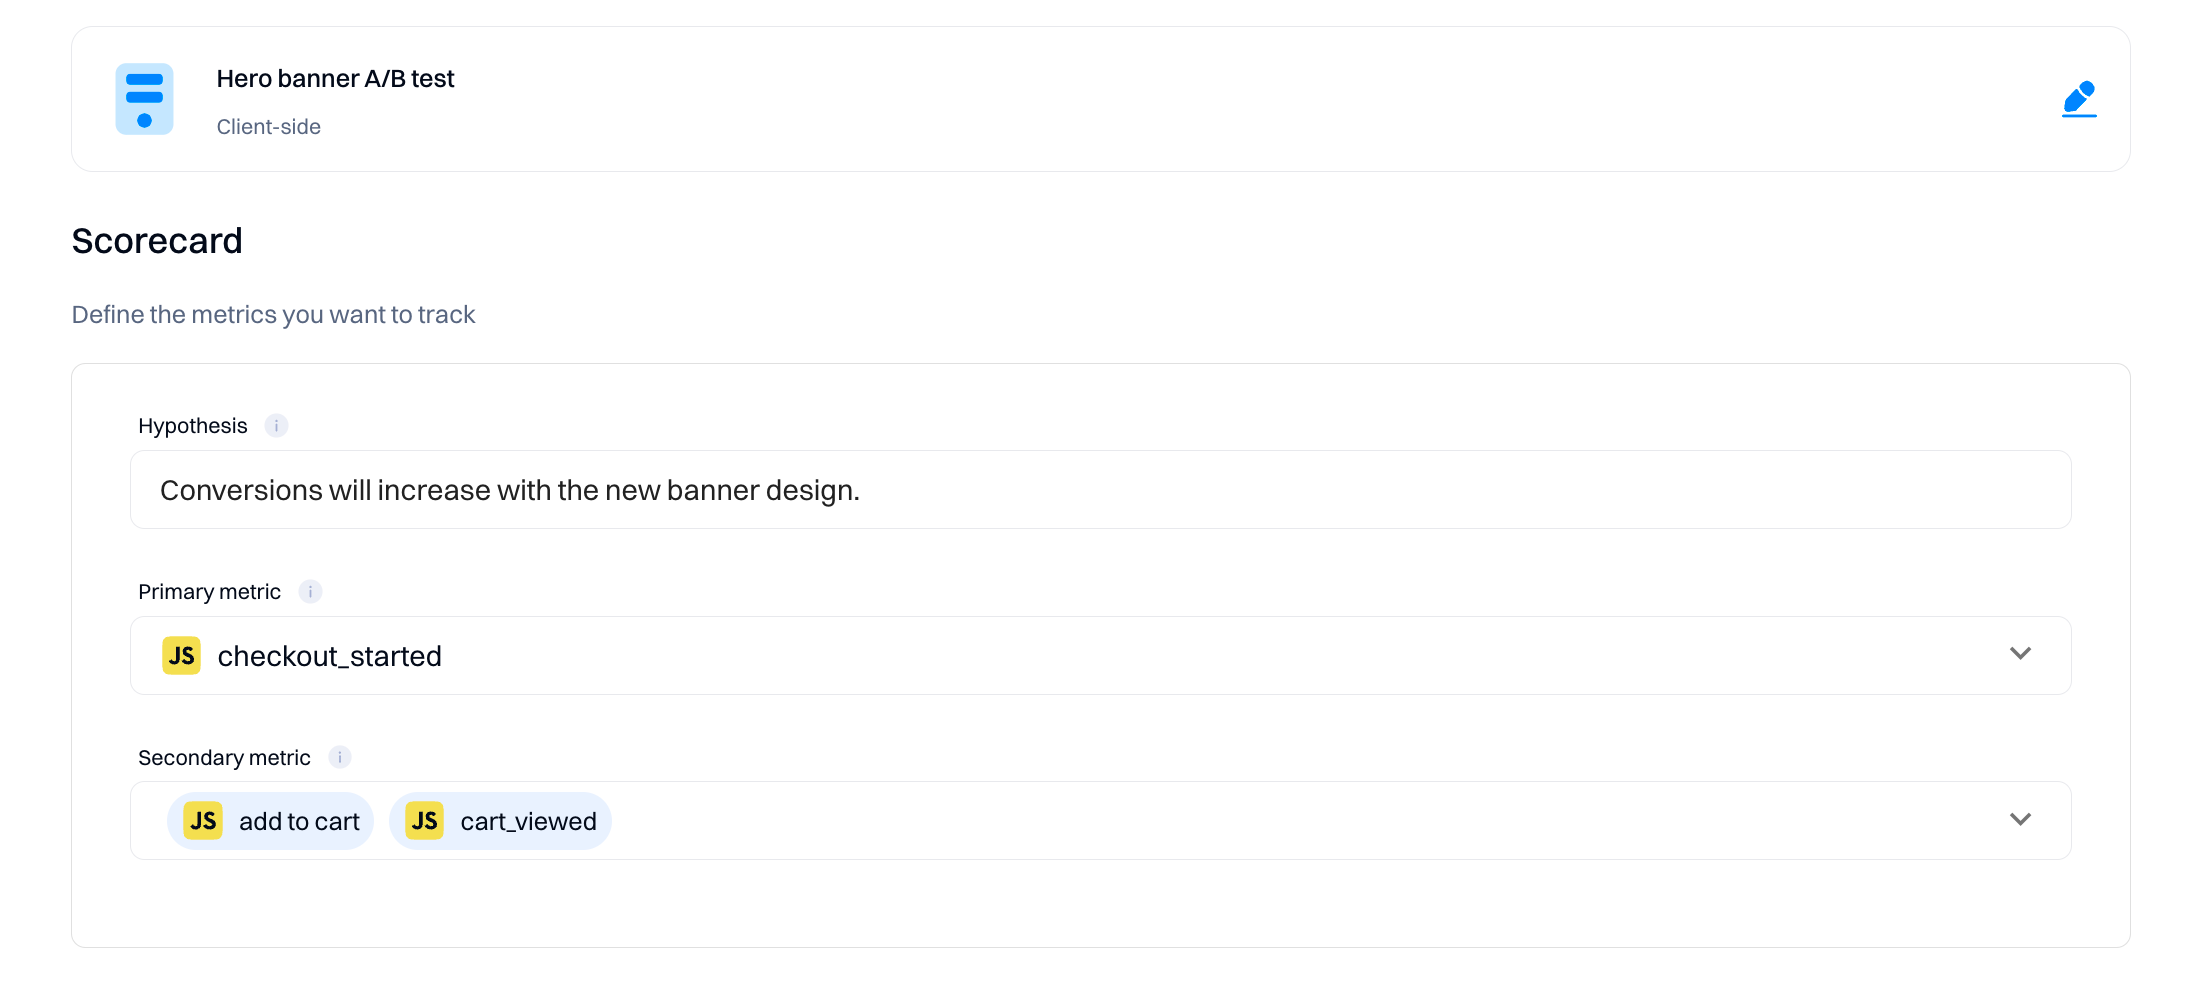
Primary metrics are the metrics you want to influence directly with your experiment. Secondary metrics are those you may want to monitor or ensure don't regress with your test but aren't directly trying to move.
Configuring the scorecard is optional but especially helpful to ensure that other team members viewing your experiment have context on the hypothesis being tested and how success is measured. Additionally, all metrics added to the Scorecard are pre-computed daily and eligible for more advanced statistical treatments like CUPED and Sequential Testing.
Configure the statistical setup
The statistical setup is the basis for determining the results of your experiments—all metrics will be calculated based on this configuration.
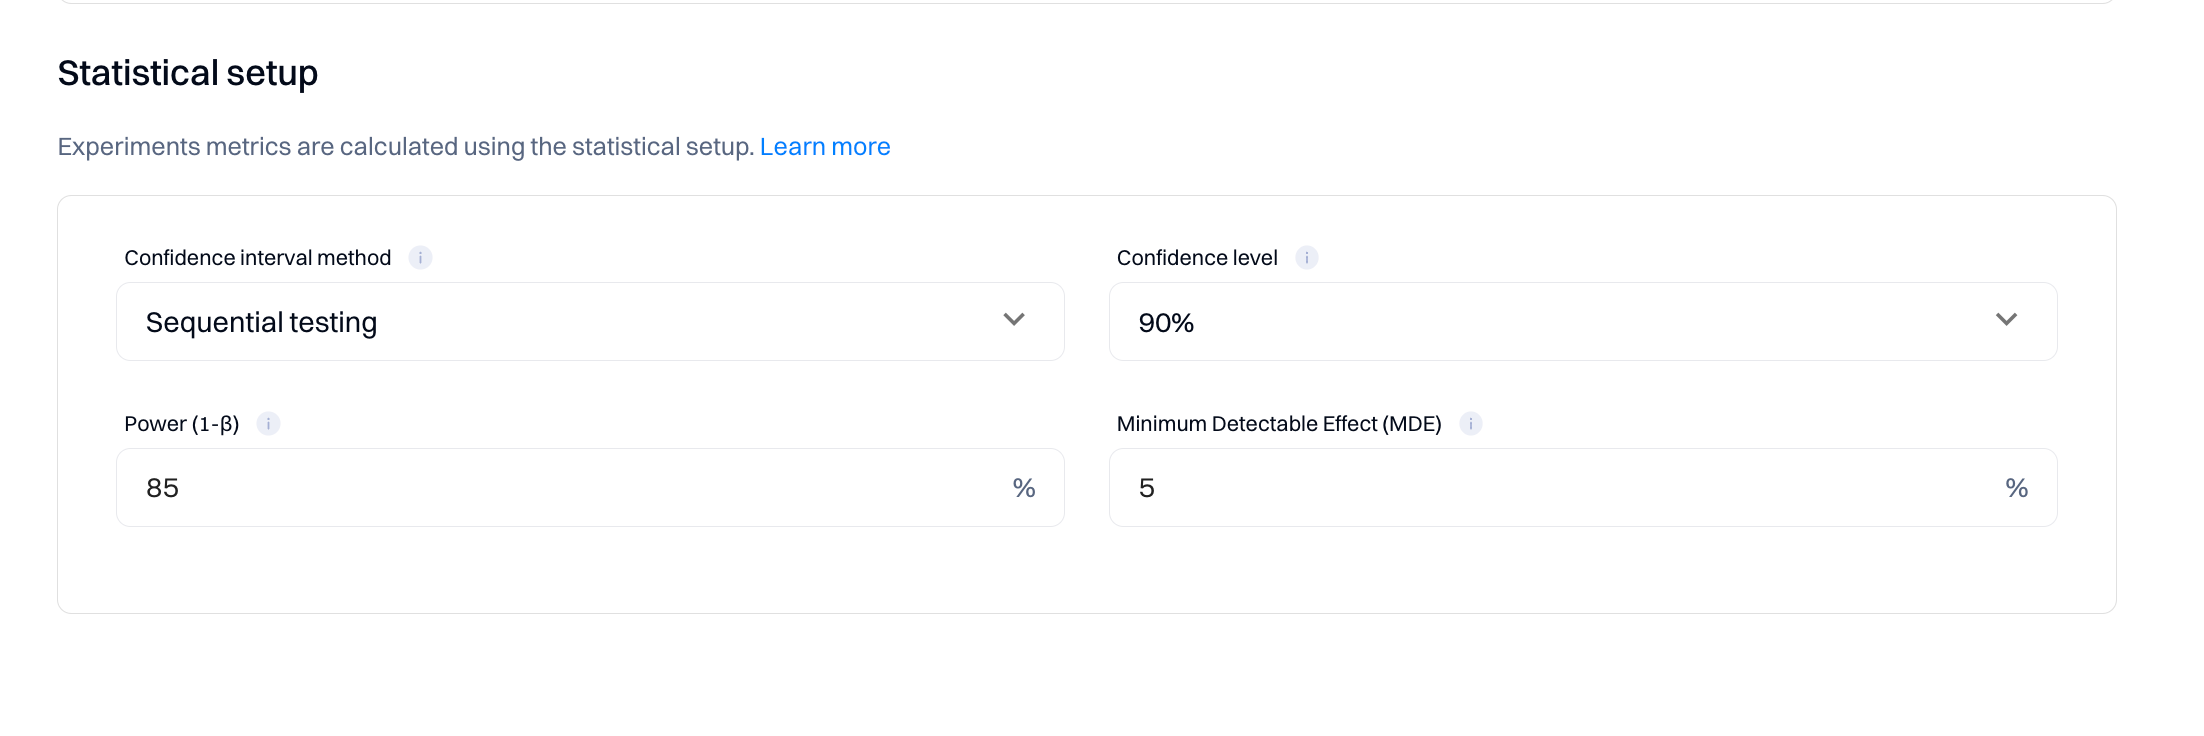
Refer to the following explanations when updating the default values.
1. Confidence Interval Method
In A/B testing, selecting the right confidence interval method is crucial for accurately analyzing your experiments. Intempt offers two methods: "Sequential testing" and "Sequential testing with CUPED variance reduction."
Sequential Testing
Sequential testing is a method used to evaluate the results of an experiment as the data comes in rather than waiting until the end of the test period. This approach allows for early stopping either for success if a significant result is detected or for futility if it becomes clear that continuing the test is unlikely to yield useful information. It contrasts with Bayesian tests, which calculate the probability of one variant being better than another at any point, allowing continuous monitoring without a fixed sample size. Sequential testing, however, relies on predefined rules for stopping, which can make it more structured but potentially less flexible than Bayesian approaches.
Sequential Testing with CUPED Variance Reduction
CUPED, which stands for Controlled-experiment Using Pre-Experiment Data, is a technique that reduces variance in your experimental data. By adjusting the observed outcomes using data collected before the experiment (like historical user behavior), CUPED can improve the efficiency of sequential testing by making it easier to detect true effects from the noise. This method is especially useful when dealing with high-variance metrics or when aiming to achieve results with fewer subjects.
2. Power (1-β)
Power, or 1-β, is a statistical measure representing the probability that your experiment will correctly reject a false null hypothesis (i.e., detect a real effect when it exists). In simpler terms, it's the likelihood that if your variant has a true impact, your test will pick it up. For Intempt, you can set the power anywhere from 0% to 100%. Higher values indicate a greater probability of detecting true differences, reducing the risk of Type II errors (false negatives). Adjusting the power helps balance the sensitivity of your tests and resource allocation.
3. Confidence Level
The confidence level is the probability that the value of a parameter falls within a specified range of the true value. Intempt allows you to select from three confidence levels for your A/B tests:
- 90% Confidence Level: This level suggests there is a 90% chance that the confidence interval calculated from the test data includes the true effect. It's generally used for quicker, less critical decisions.
- 95% Confidence Level: This is the standard choice, offering a good balance between certainty and efficiency. It means there is a 95% chance that the confidence interval contains the true effect.
- 99% Confidence Level: Opt for this high level of confidence when decisions are highly impactful or costly. It provides a 99% assurance that the confidence interval includes the true effect, but requires larger sample sizes.
4. Minimum Detectable Effect (MDE)
The Minimum Detectable Effect (MDE) is the smallest effect size that your test is designed to detect reliably. In Intempt, you can set the MDE anywhere from 0% to 100%. This parameter is essential for determining the practical significance of your test outcomes. Setting a higher MDE can reduce the sample size required for your test but might miss smaller yet meaningful impacts. Conversely, a lower MDE increases the sensitivity of your test but may require more data and time to provide reliable results.
Choosing the right values for these parameters in your A/B tests with Intempt ensures that your experiments are both efficient and effective, providing reliable insights that drive informed decision-making.
Good to know
For more information about the statistical setup, go to the Statistics enginesection.
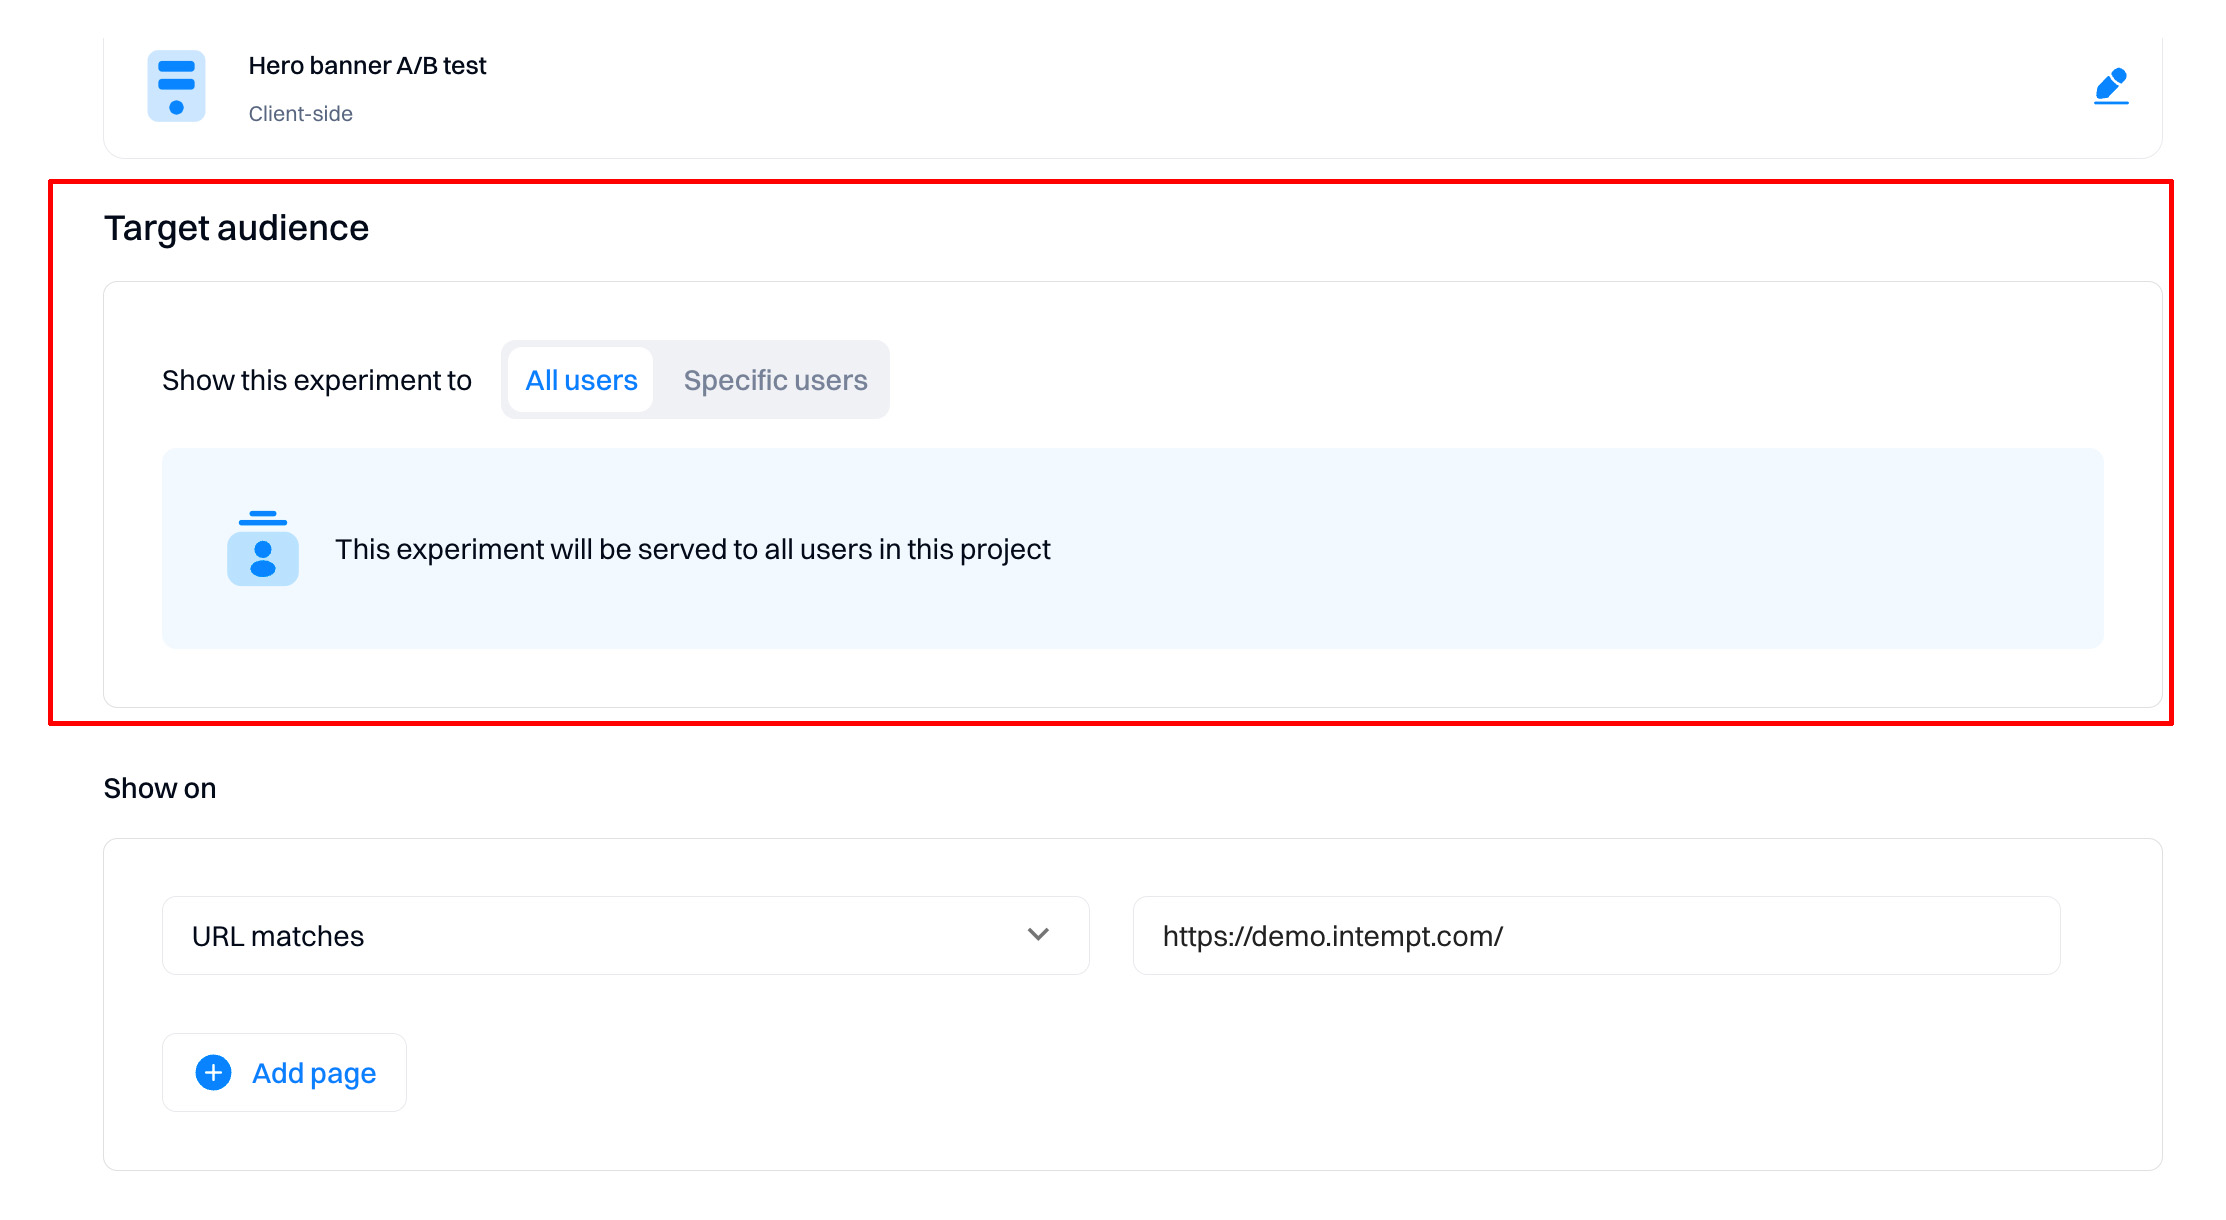
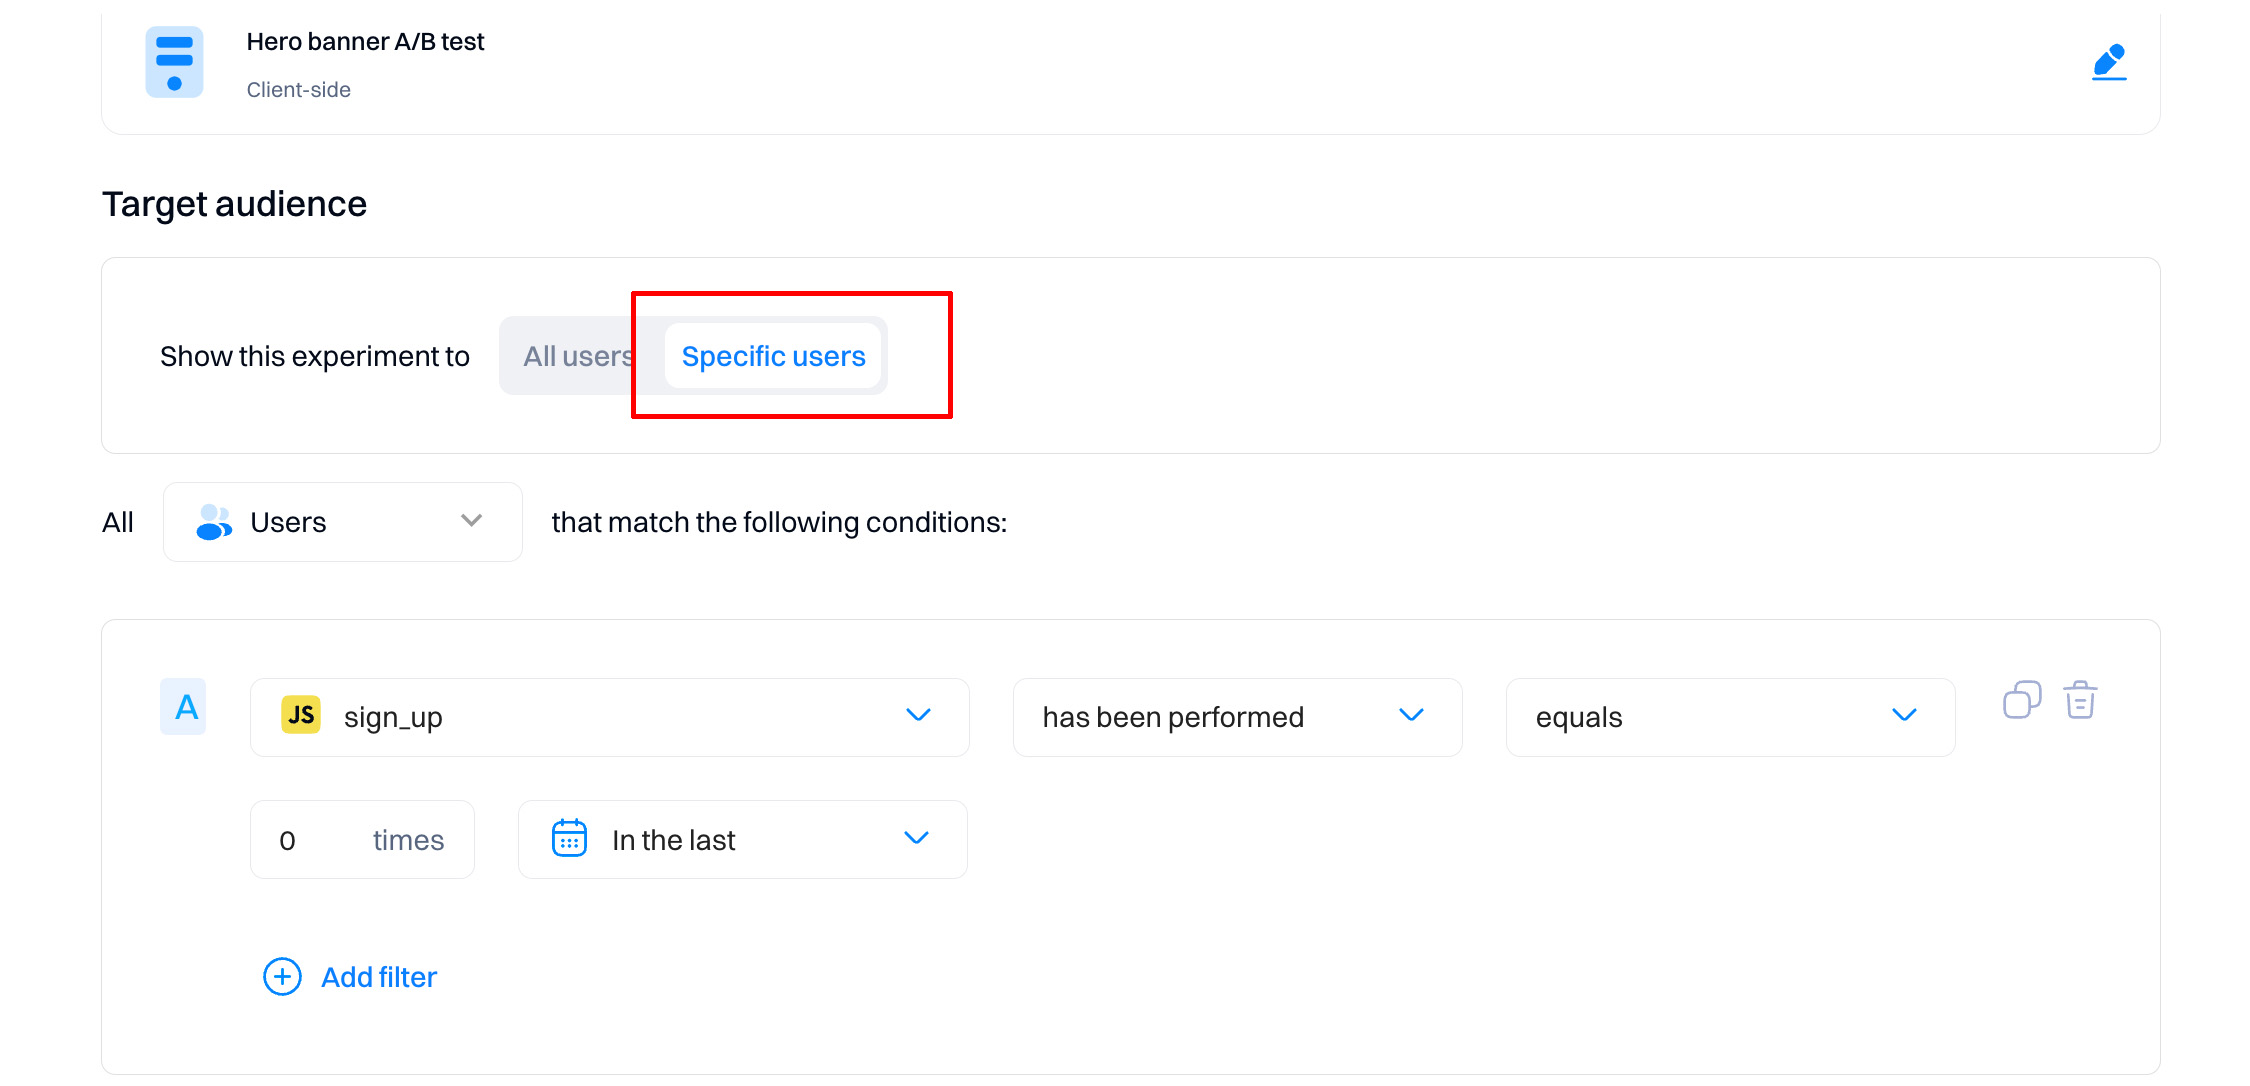
Configure target audience
Depending on your test, you may want to show the experiment to all users or target specific ones based on your selected condition (e.g., location, affinity, etc.).
If you switch to "Specific users," you can use segment editor-like targeting options to add multiple conditions and filters.
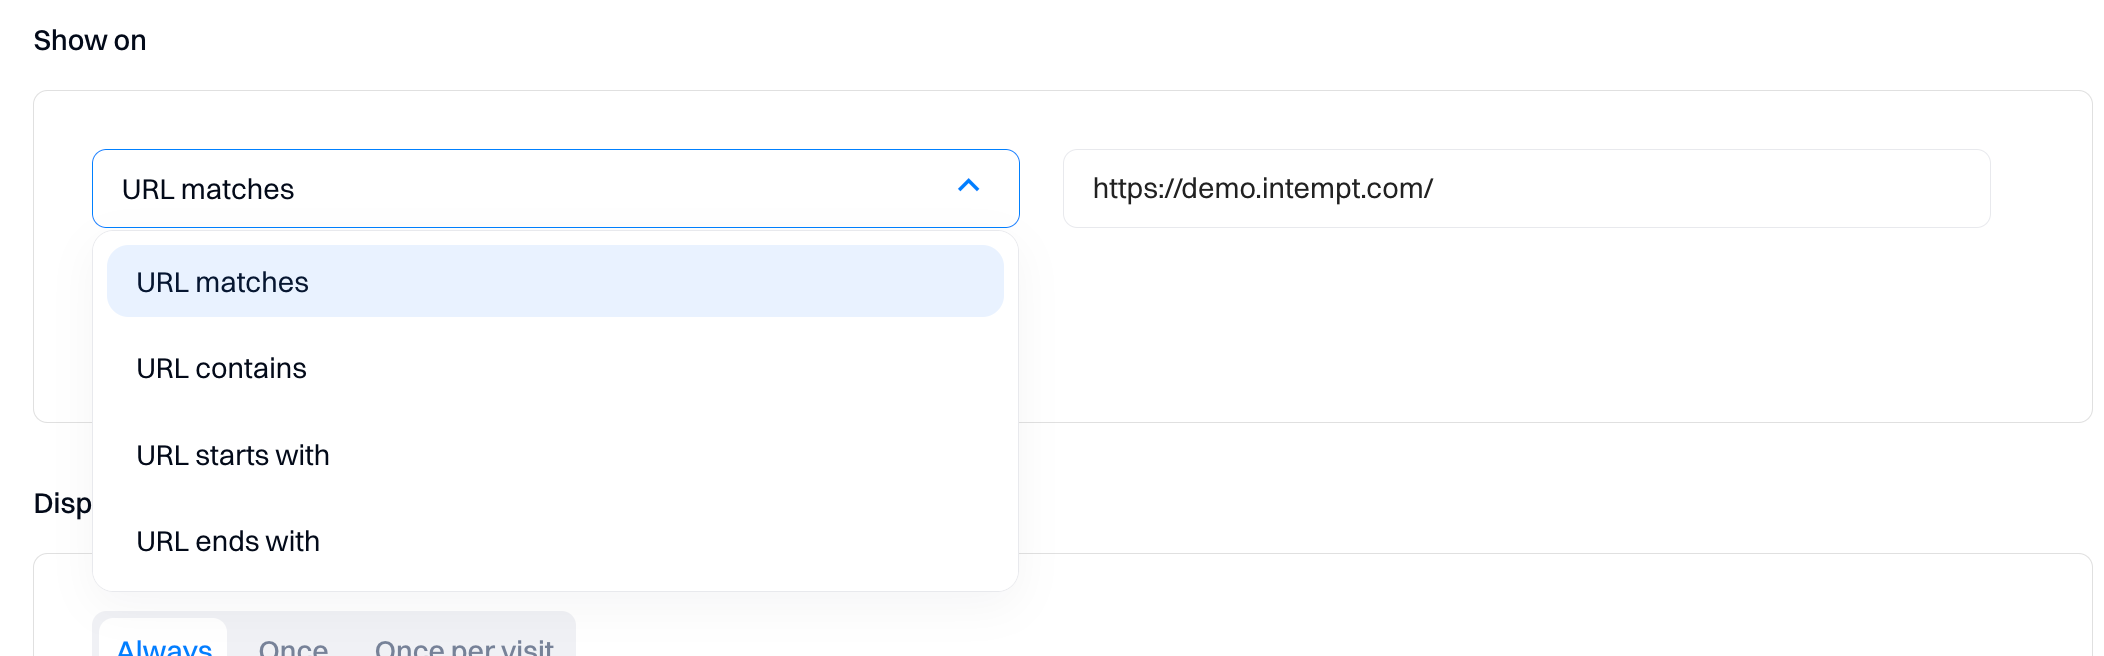
Configure on which pages the experiment will be served
This will filter out or target users visiting specific pages that match the configuration.
- URL matches - the variant will only load if it will match the exact URL parameters
- URL contains - the variant will be displayed if a specified parameter exists within the URL that the user is viewing (for example, "product" within full URL https://demo.intempt.com/products/a-line-mini-dress-blue).
- URL starts with - only consider the start of the page URL. This is useful if you want to target pages nested within a specific category, like https://demo.intempt.com/collections/ -> display on all collection pages within the site.
- URL ends with - only consider the end parameters of the page URL. This is useful if you have a specific UTM parameter to target.
Set the display options and target devices
"Display" refers to how frequently the variant will be displayed.
- Set "Always" if you want the variant displayed on each page load (if the user matches other conditions)
- Use "Once" to only allow the variant to be displayed for the user once per lifetime.
- "Once per visit" means that the variant will be displayed once per session
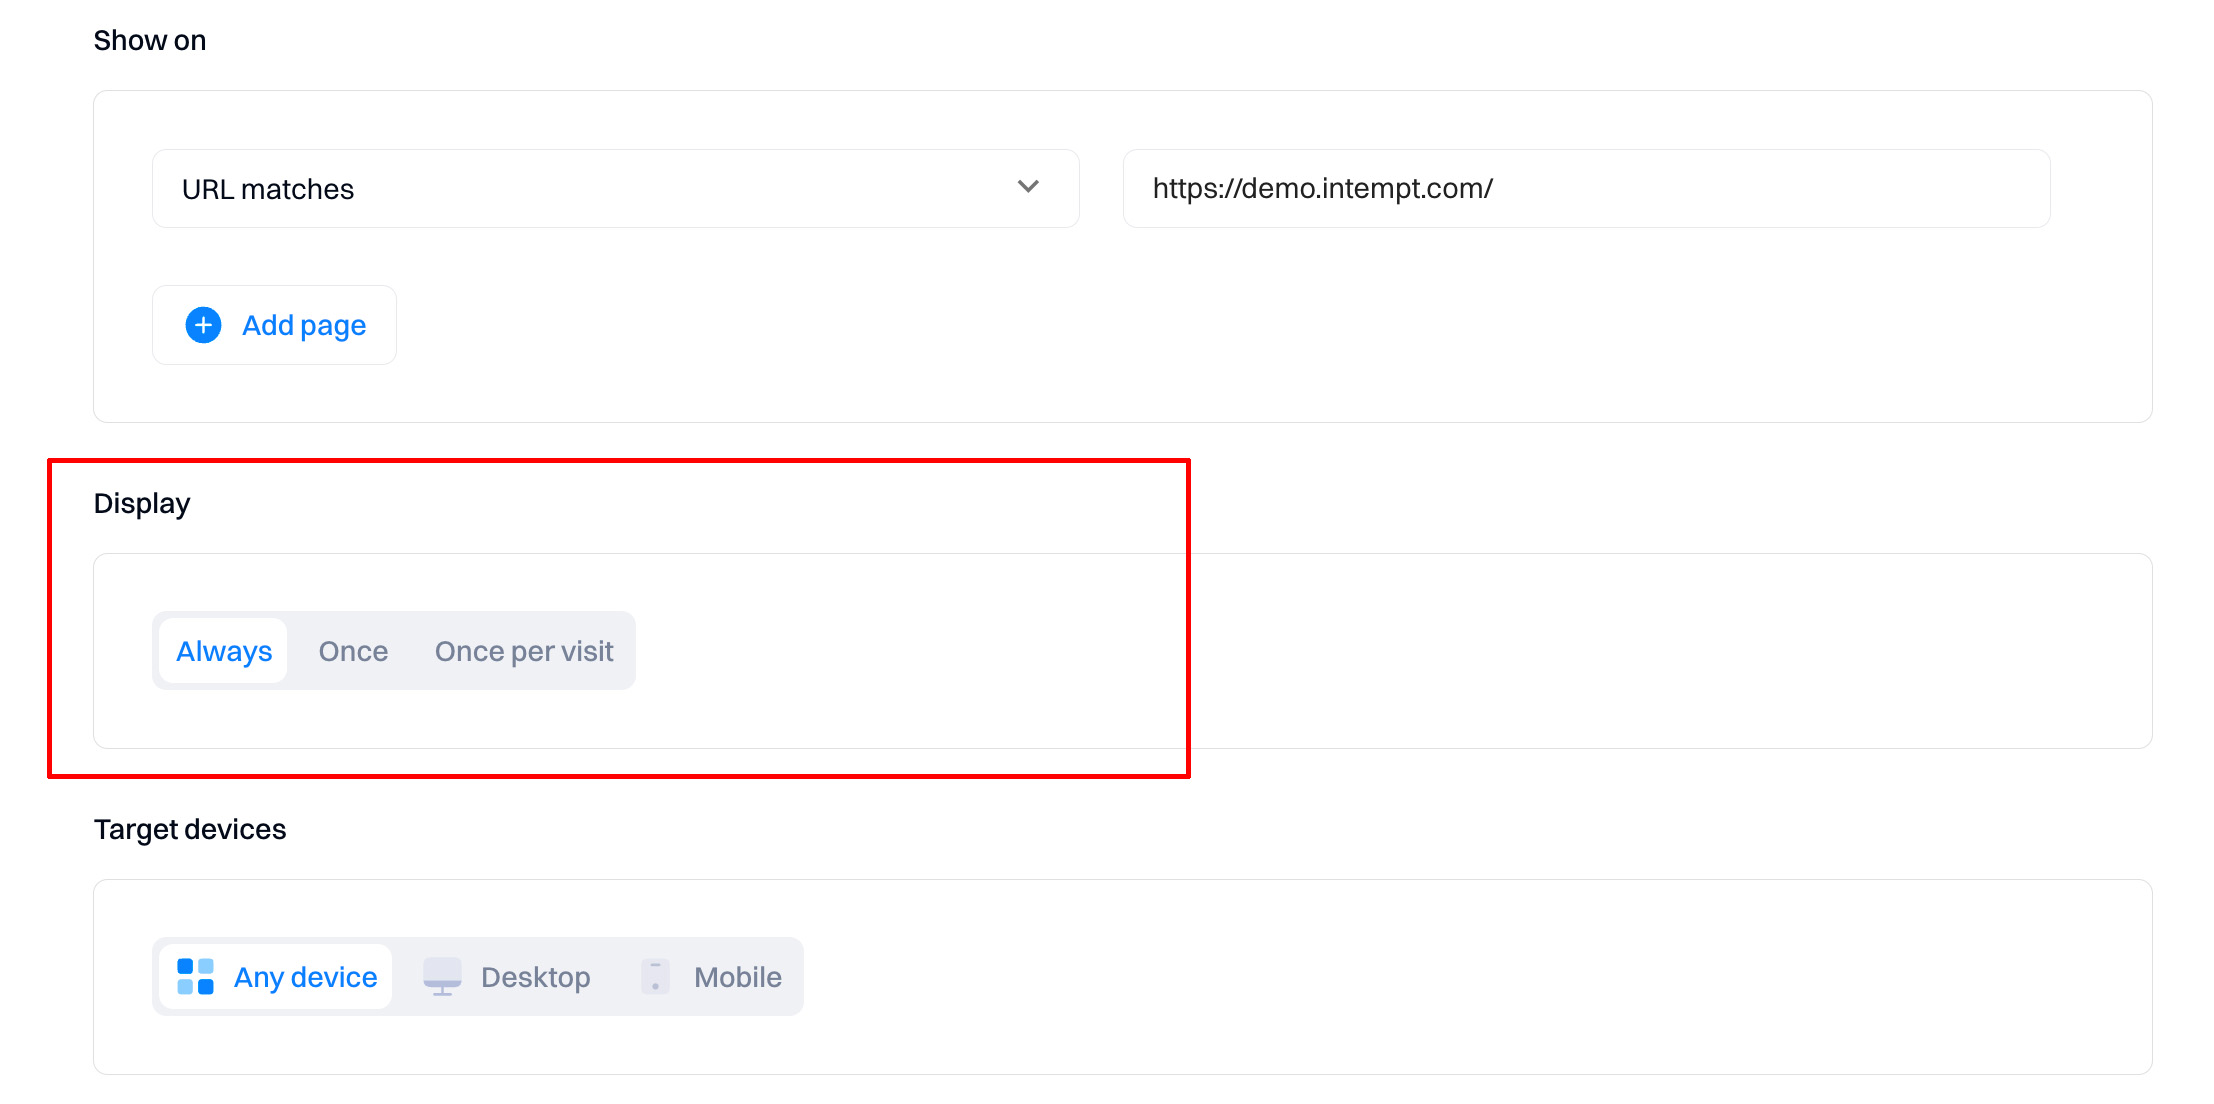
Target devices - define filters for devices that can render the experience. Configuration depends on whether you want different experiences for mobile vs desktop users.
Start or schedule the experiment
When you reach the final step of creating your experiment in Intempt, you must decide when the experiment will begin. This section guides you through setting up the experiment start time.
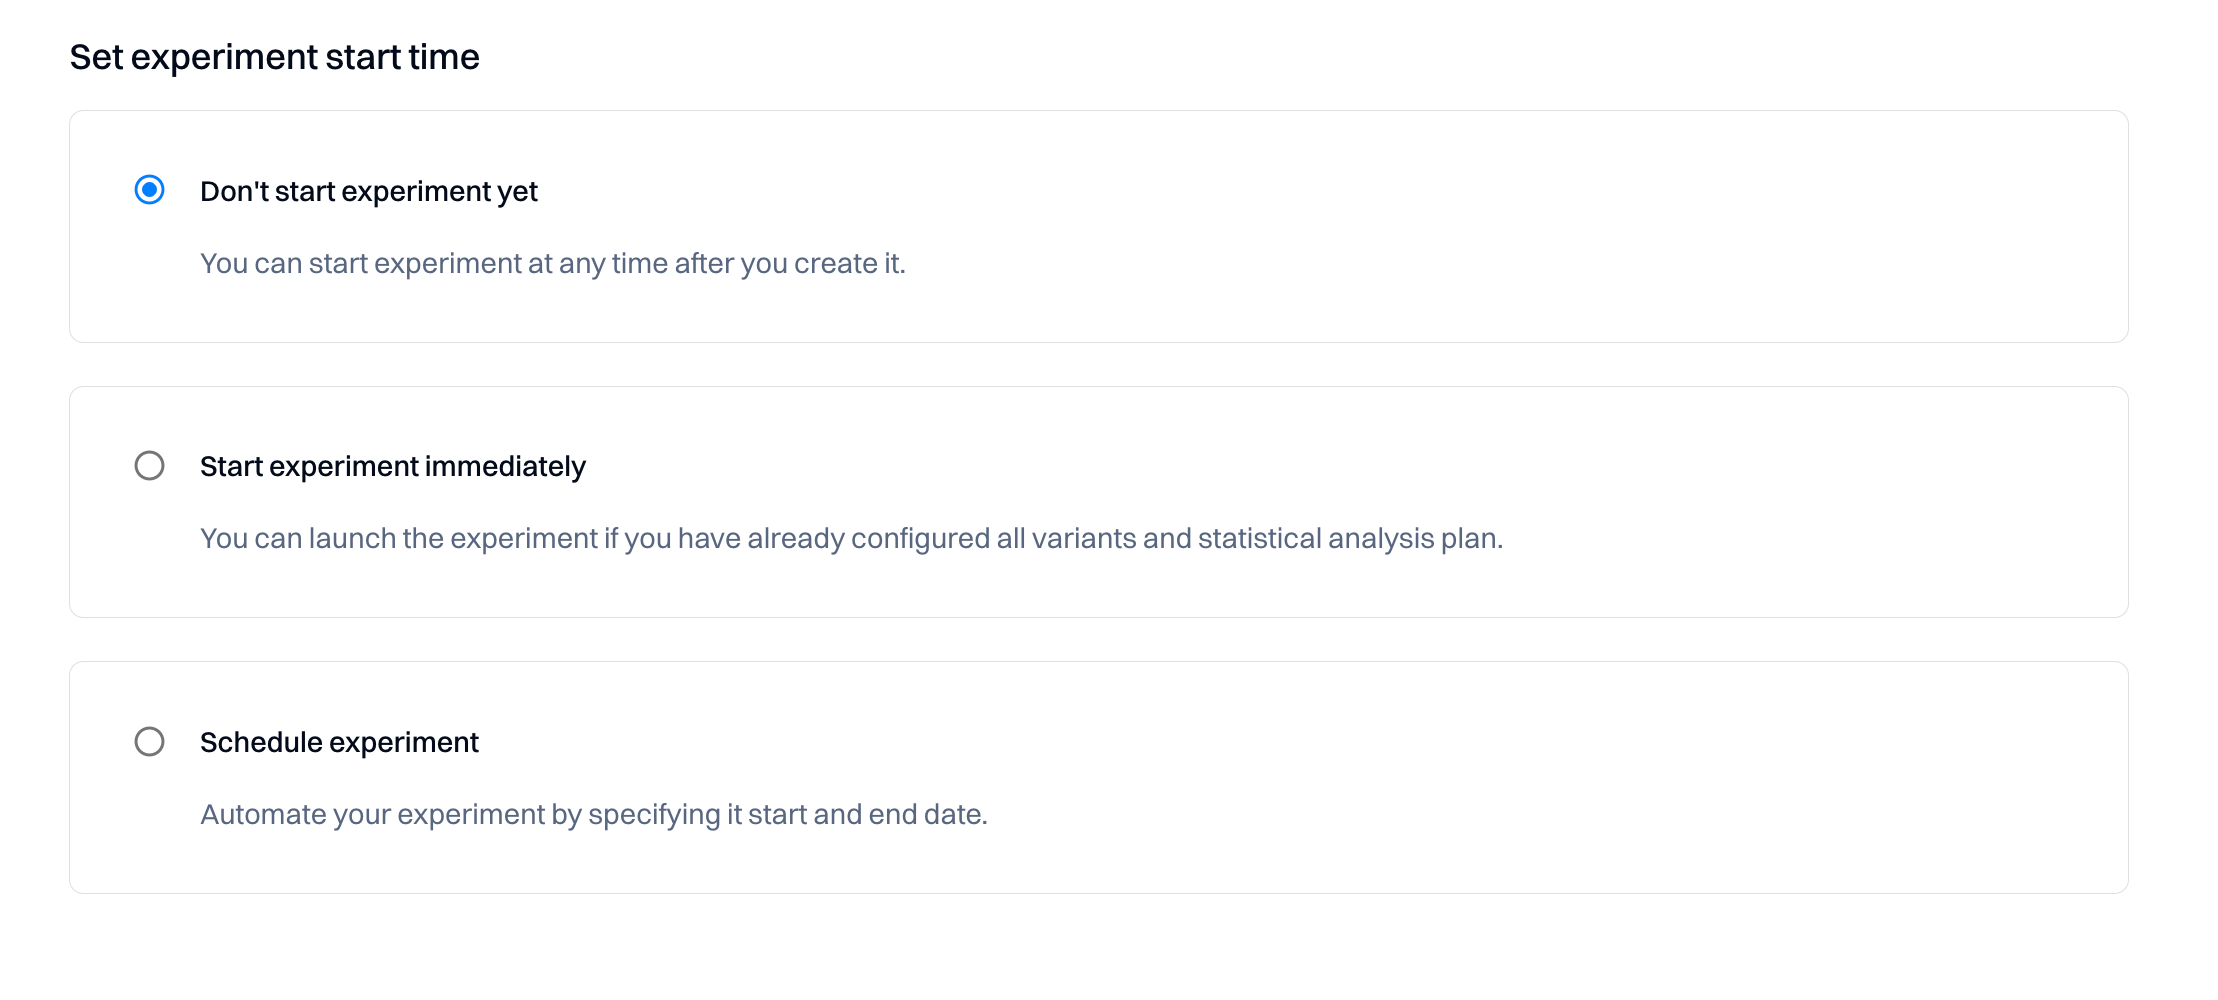
You have three start time options to choose from:
Option 1: Don't start experiment yet
- Description: Select this if you're not ready to launch the experiment immediately after creation.
- Usage: This option provides flexibility, allowing you to activate the experiment anytime post-creation.
- Instructions: choose this option if you wish to postpone the experiment's start.
Option 2: Start the experiment immediately
- Description: Opt for this if your experiment setup is complete and ready to go live.
- Usage: Ideal when all variants and the statistical plan are configured, and you're eager to collect data.
- Instructions: Select this radio button to initiate the experiment as soon as you conclude the setup process.
Option 3: Schedule experiment
- Description: Use this to automate the experiment's start and end based on a predetermined schedule.
- Usage: This is Perfect for aligning the experiment with specific dates or events or ensuring it runs within a defined timeframe.
- Instructions: specify the exact start and end dates after choosing this option.
How to set the start time
Follow these steps to set your preferred start time:
- Review the three options and decide which aligns with your experiment's requirements.
- Click the radio button adjacent to your chosen method.
- If you're scheduling the experiment, additional fields will appear to enter the start and end dates.
- Complete any remaining setup tasks and finalize your experiment configuration.
By selecting the appropriate start time option, you ensure that your experiment aligns with your project timeline and data collection goals.
Managing the experiment
Tabs overview
Tabs allow you to edit the experiment based on different sections.
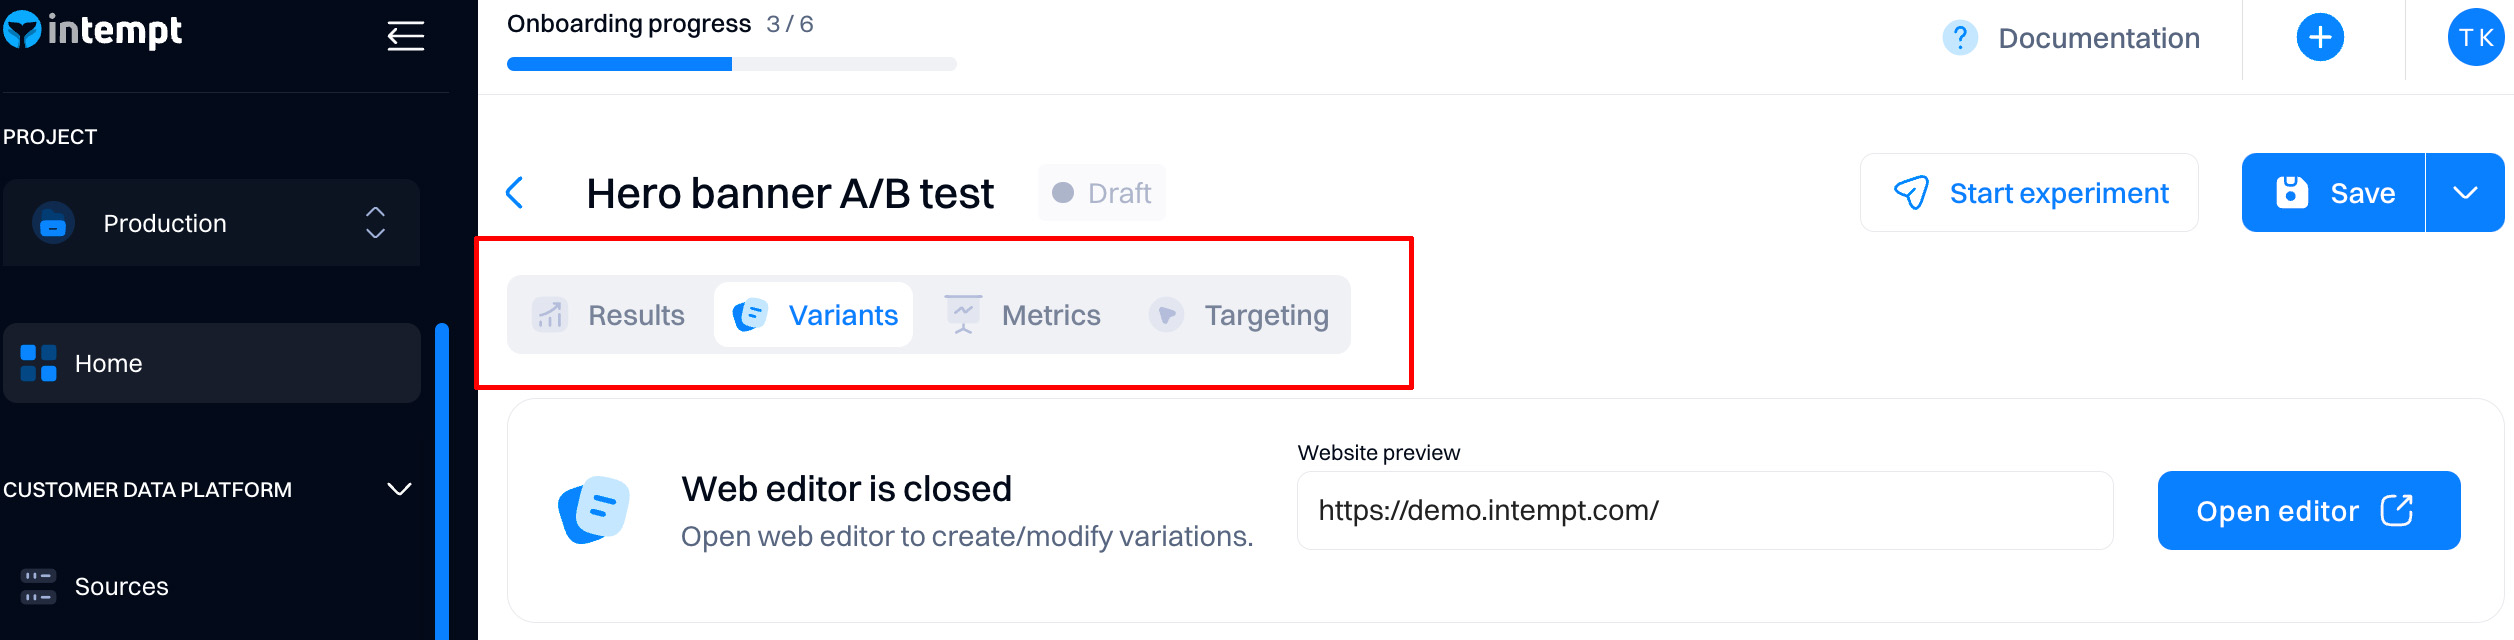
- Results. View the experiment's performance —if it reaches statistical significance, you can make the decision.
- Variants. Create and edit variations and traffic distribution.
- Metrics. Configure the metrics that determine the results and the statistical setup.
- Targeting. Configure which users and devices will get the experiment and on which URLs.
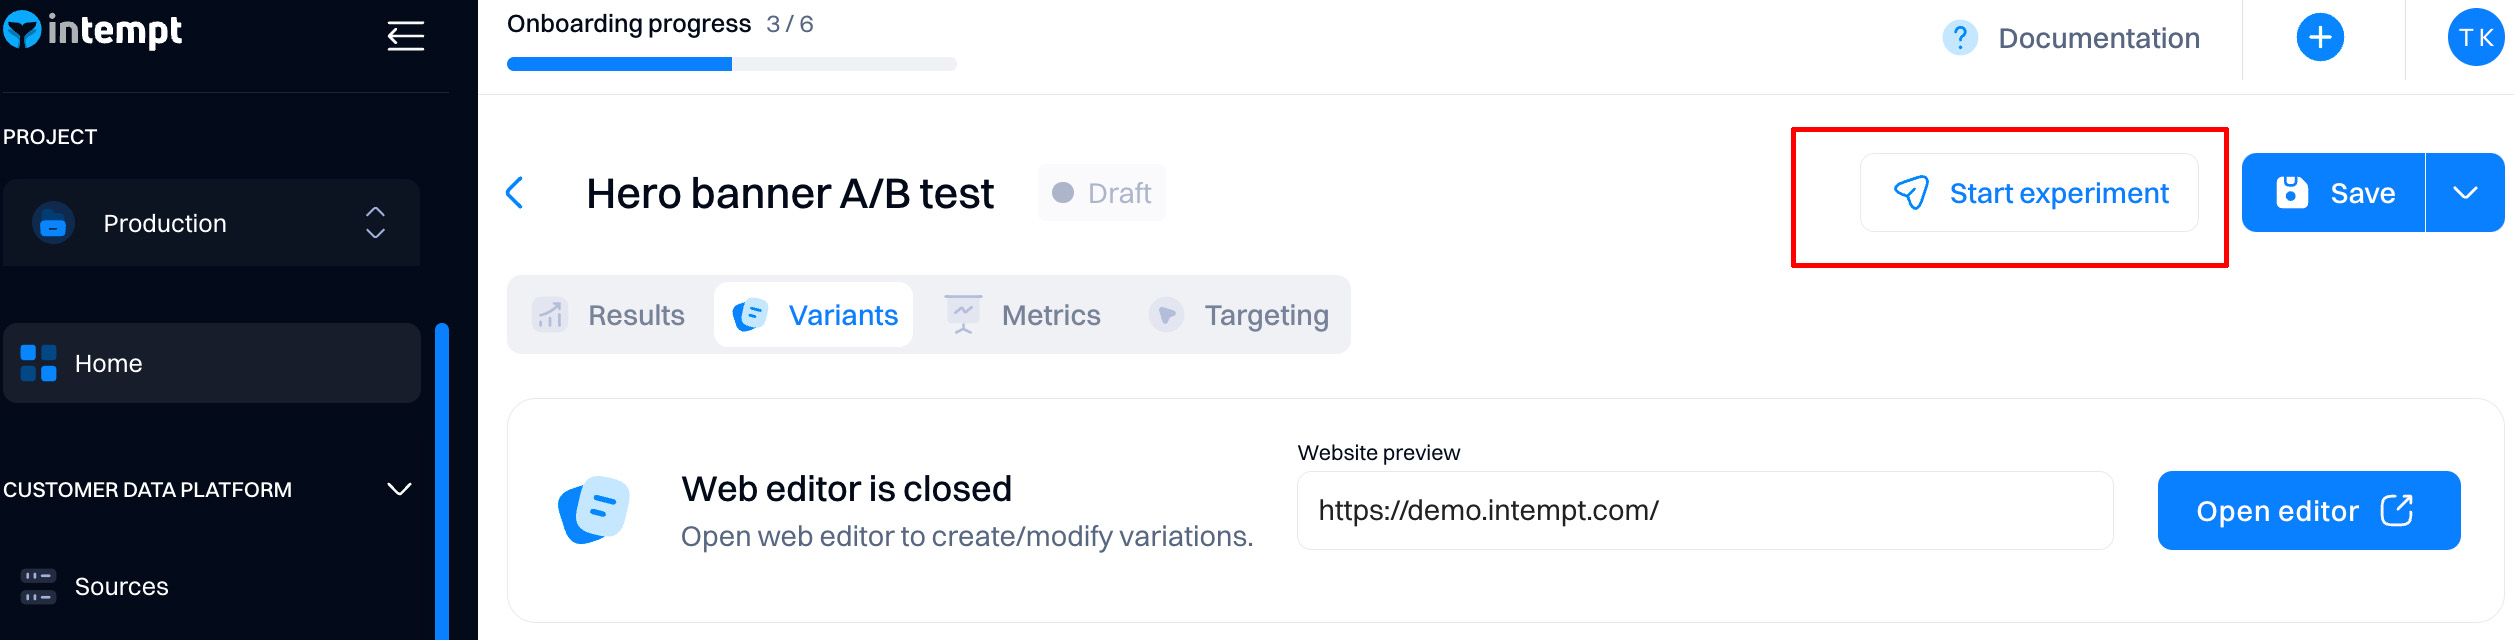
How to start the experiment
You can start the experiment by selecting the "Start experiment" option. Alternatively, you can choose the "Schedule" option under the secondary "Save" button.
Experiment states
During the lifecycle of the experiment, the states will be updated based on the experiment's progress.
Draft
- Description: An experiment in 'Draft' is being prepared or edited. No data collection is occurring at this stage.
- Usage: Ideal for setting up the experiment's variables, hypotheses, and statistical models.
- Next Steps: Finalize the experiment's configurations and, when ready, move it to the 'Running' state to begin data collection.
Scheduled
- Description: The 'Scheduled' state is assigned to experiments with a planned future start date.
- Usage: Opt for this state if you want the experiment to commence automatically at a specific time.
- Next Steps: The experiment will automatically transition to 'Running' on the scheduled start date.
-
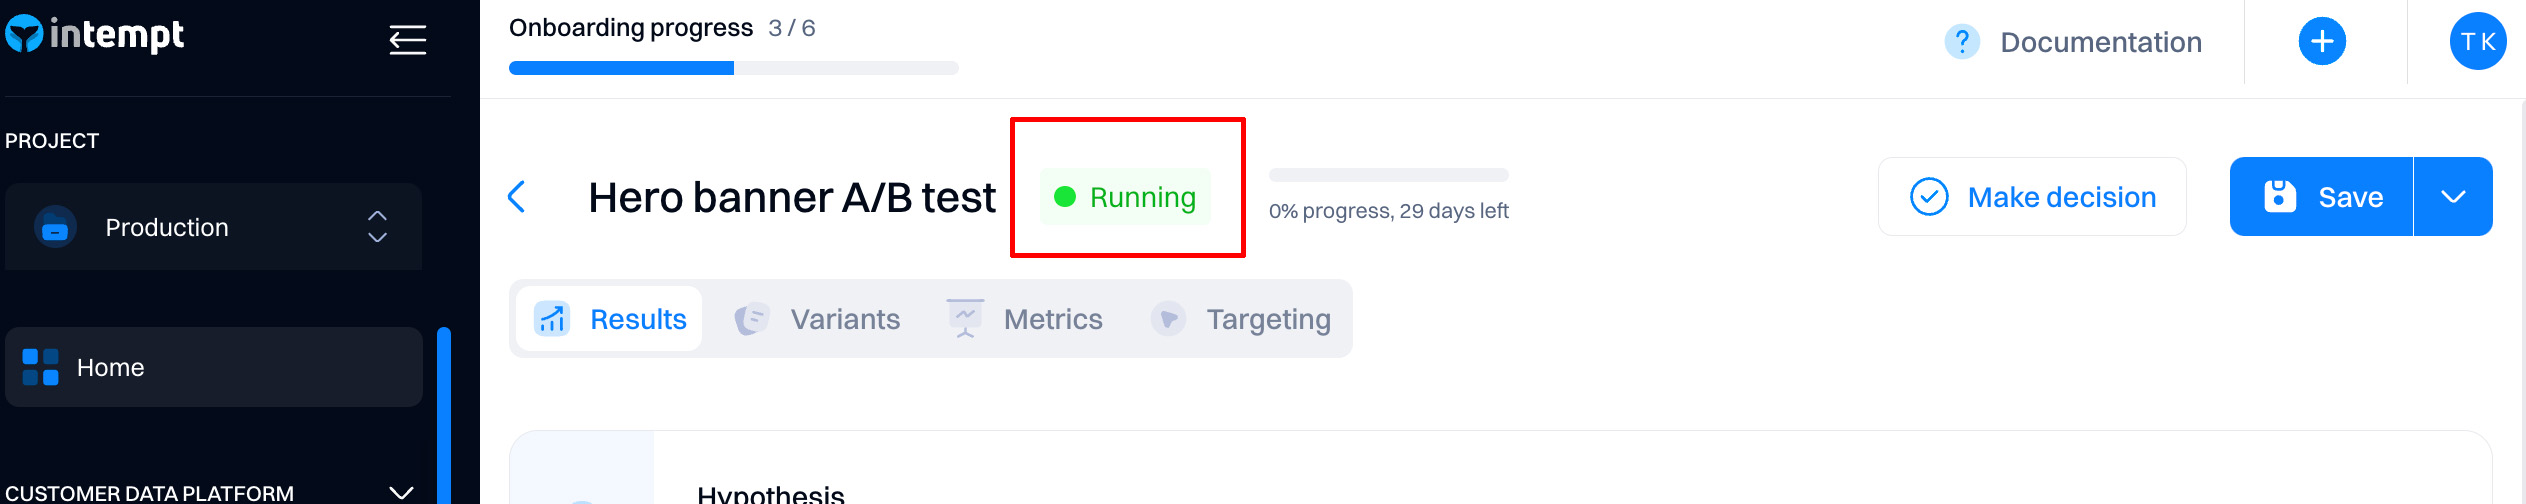
Running
- Description: 'Running' indicates that the experiment has been launched and data is actively being collected.
- Usage: This phase collects live data as users interact with the tested variations.
- Next Steps: Once enough data is collected to make an informed decision, shift the experiment to 'Ready for review.'
Ready for review
- Description: In 'Ready for review,' the experiment has finished collecting data and awaits detailed analysis. The experiment will transition to this state after your experiment end date passes.
- Usage: Use this phase to analyze the data, evaluate the performance of each variation, and understand the outcomes.
- Next Steps: Depending on the review, mark the experiment as 'Completed' or adjust and extend the 'Running' phase if needed.
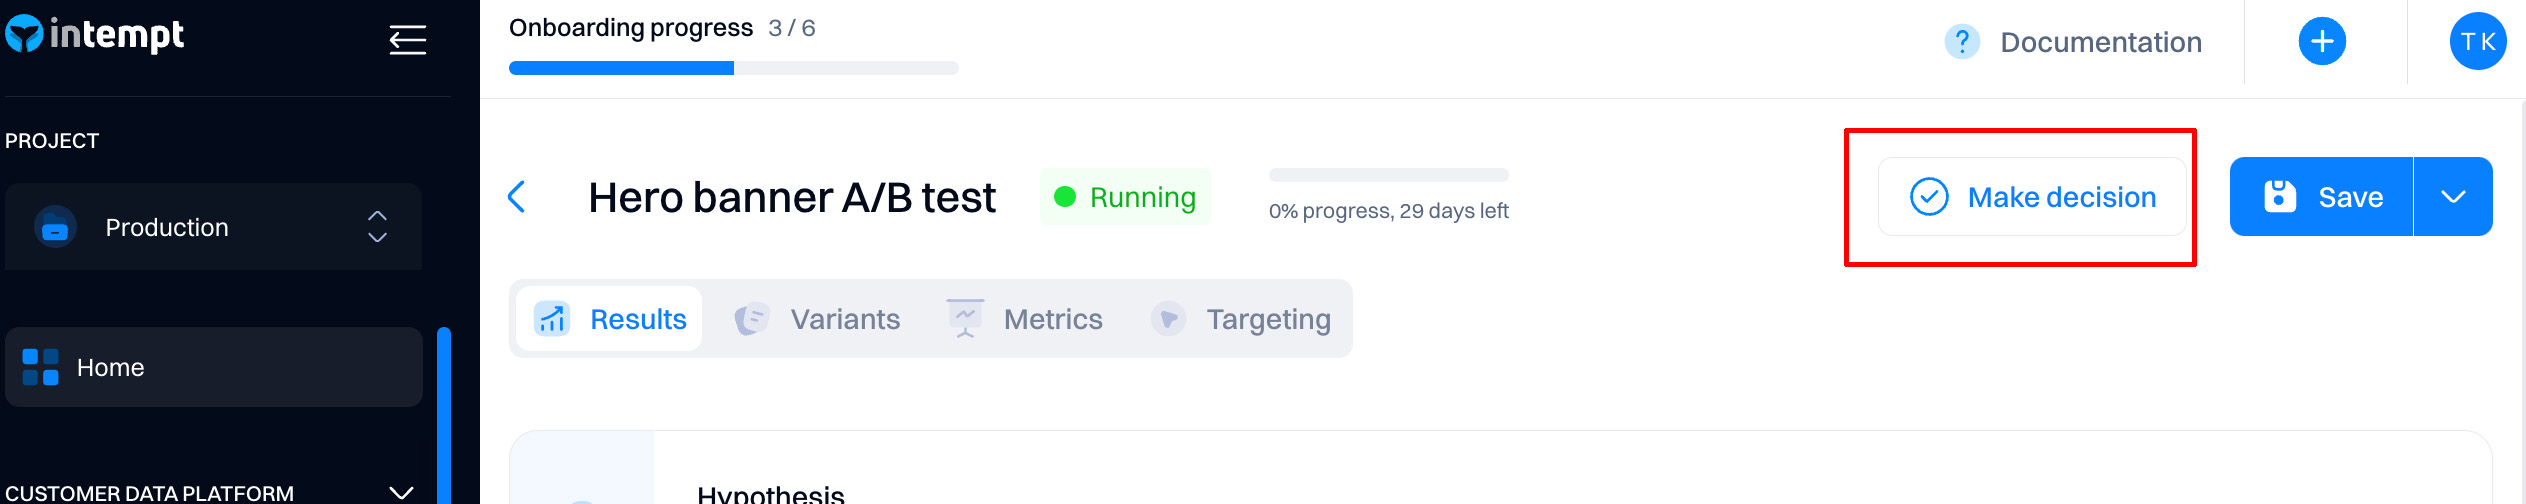
Completed
- Description: A 'Completed' experiment has ended with a final decision made based on the collected data. You must click "Make decision" to transition the experiment to the "Completed" state.
- Usage: The completion phase documents the findings, shares results, and implements insights gained.
- Next Steps: Utilize the results for business decisions, make necessary changes, or develop new insights-based experiments.
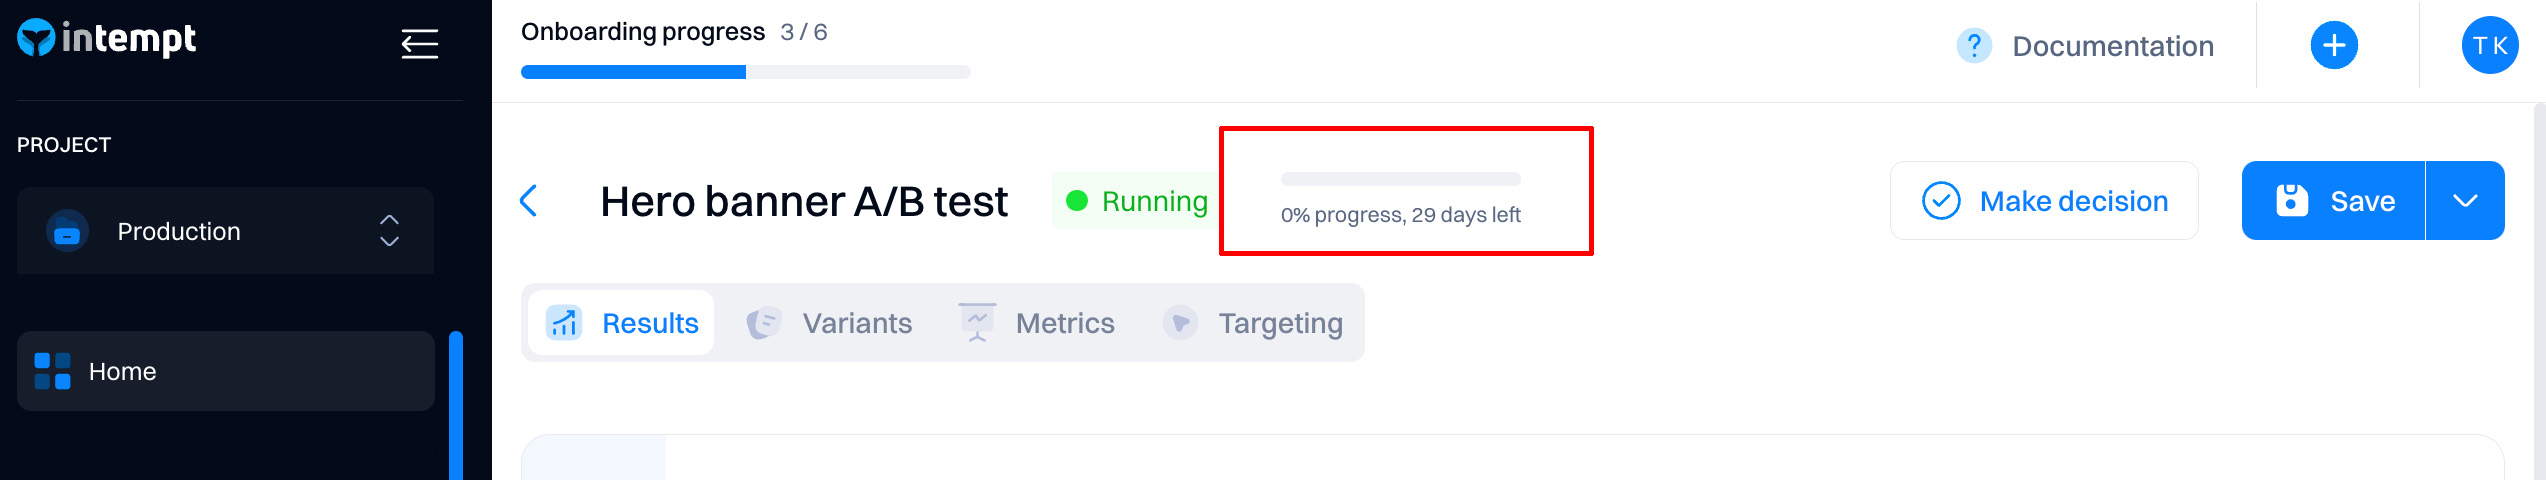
Experiment duration and end-date
Each experiment requires you to set an end date. After that, the experiment state will change to "Ready for review."
Note that the progress bar shows the progress based on the end date defined.
Choosing an end date for your experiment
Selecting an experiment's end date is crucial to obtaining valid and actionable results. Here's a guide to help you choose an appropriate end-date:
-
Statistical Significance
- Aim for a duration that allows enough data collection to achieve statistical significance.
- Your sample size should satisfy the power and minimum detectable effect (MDE) you've set.
-
Business Cycles
- Align your experiment's end-date with your business cycles to avoid confounding effects.
-
Seasonality
- Consider the potential impact of seasonality and aim to capture full business cycles.
-
Variation Performance
- If applying sequential testing, end the experiment once there's a statistically clear winner, respecting stopping rules.
-
Urgency of Implementation
- The need for quick results may influence your end-date but weigh this against the potential trade-off in data reliability.
Evaluating the experiment
Check out Experiment analyticsfor a complete overview of how to evaluate your experiment performance.
Updated 3 days ago